Is Data Modeling Dead with Text-to-SQL? How Wren AI Bridges Modern BI and Traditional Practices
Discover why data modeling is more essential than ever in the age of Text-to-SQL solutions. Learn how Wren AI leverages well-structured, business-oriented datasets to deliver accurate, intuitive insights—combining the best of traditional BI best practices with cutting-edge natural language analytics.

Howard Chi
Updated: Dec 18, 2025
Published: Dec 21, 2024
From our team at Wren AI, the most common question we hear from our users is: “Can we just connect Wren AI’s Text-to-SQL solution directly to our raw data? Isn’t data modeling unnecessary now that AI can figure it all out?” While it’s true that modern AI-driven tools like Wren AI have revolutionized how we interact with data, the idea that data modeling no longer matters is a misconception. On the contrary, clean, well-structured, and business-oriented datasets are more essential than ever. Without this strong foundation, AI solutions struggle to translate natural language queries into reliable insights.
In this article, we’ll explain why data modeling isn’t dead in the era of Text-to-SQL, highlight the limitations of relying solely on raw data, and show how you can still borrow from traditional BI best practices to optimize your Wren AI implementation. The goal is not to eliminate modeling but to leverage it so that Wren AI can deliver the accurate, intuitive, and actionable analytics experience your business users expect.
Preface
Data analytics has always been about turning raw information into actionable insights. Historically, this process required specialized data analysts and BI developers who wrote complex SQL queries, built semantic layers, and carefully modeled data. In recent years, text-to-SQL tools have emerged, promising a new era of direct, natural language interaction with data.
But as these technologies advance, a question often arises: Is data modeling dead? After all, if anyone can just ask questions in plain English and get answers, why bother with complex data modeling, semantic layers, or precomputed metrics?
The reality is that data modeling is more crucial than ever before. While Text-to-SQL solutions like Wren AI offer a powerful new interface for data consumers, they are most effective when built on top of a strong, well-structured data foundation. In this article, we’ll explore the current limitations of text-to-SQL, discuss why data modeling remains essential, and provide concrete examples from traditional BI implementations. We’ll also outline how you can leverage your existing modeling work to get the most out of Wren AI — ensuring that data democratization doesn’t come at the expense of accuracy, consistency, and reliability.
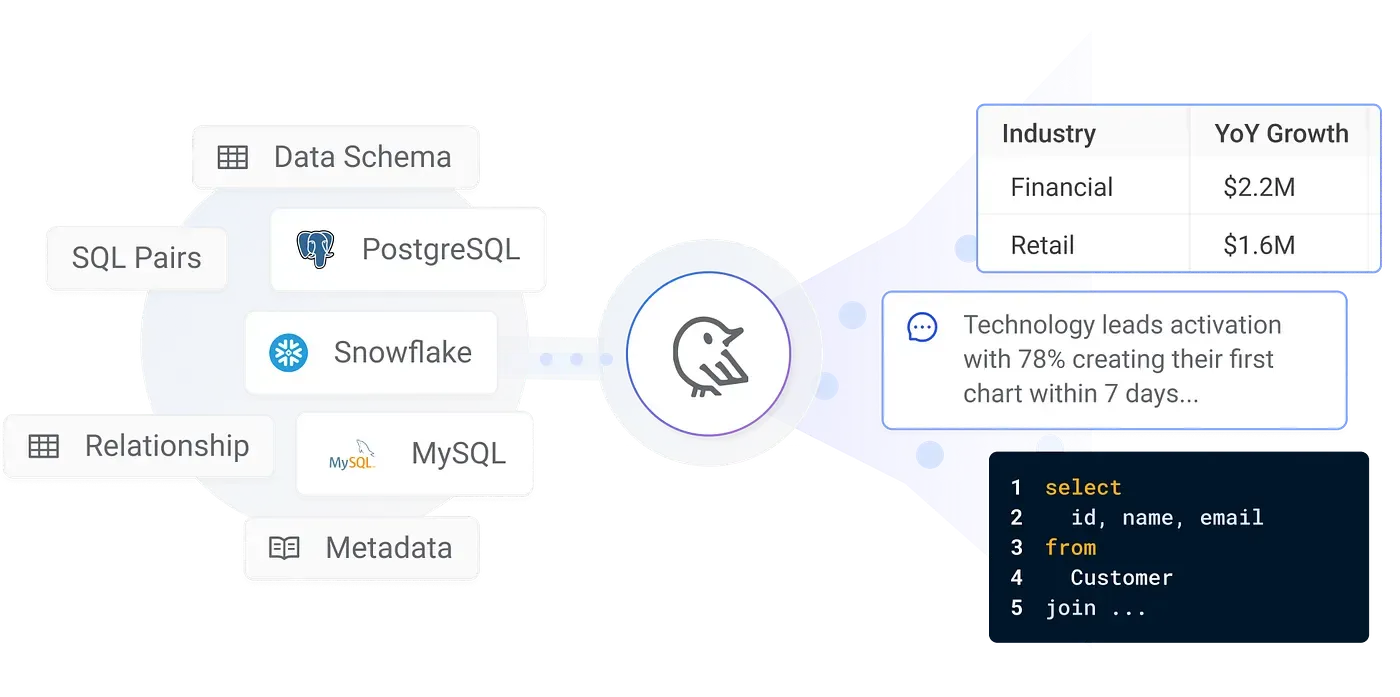
Using Wren AI to retrieve data from databases
The Rise of Text-to-SQL: Why All the Buzz?
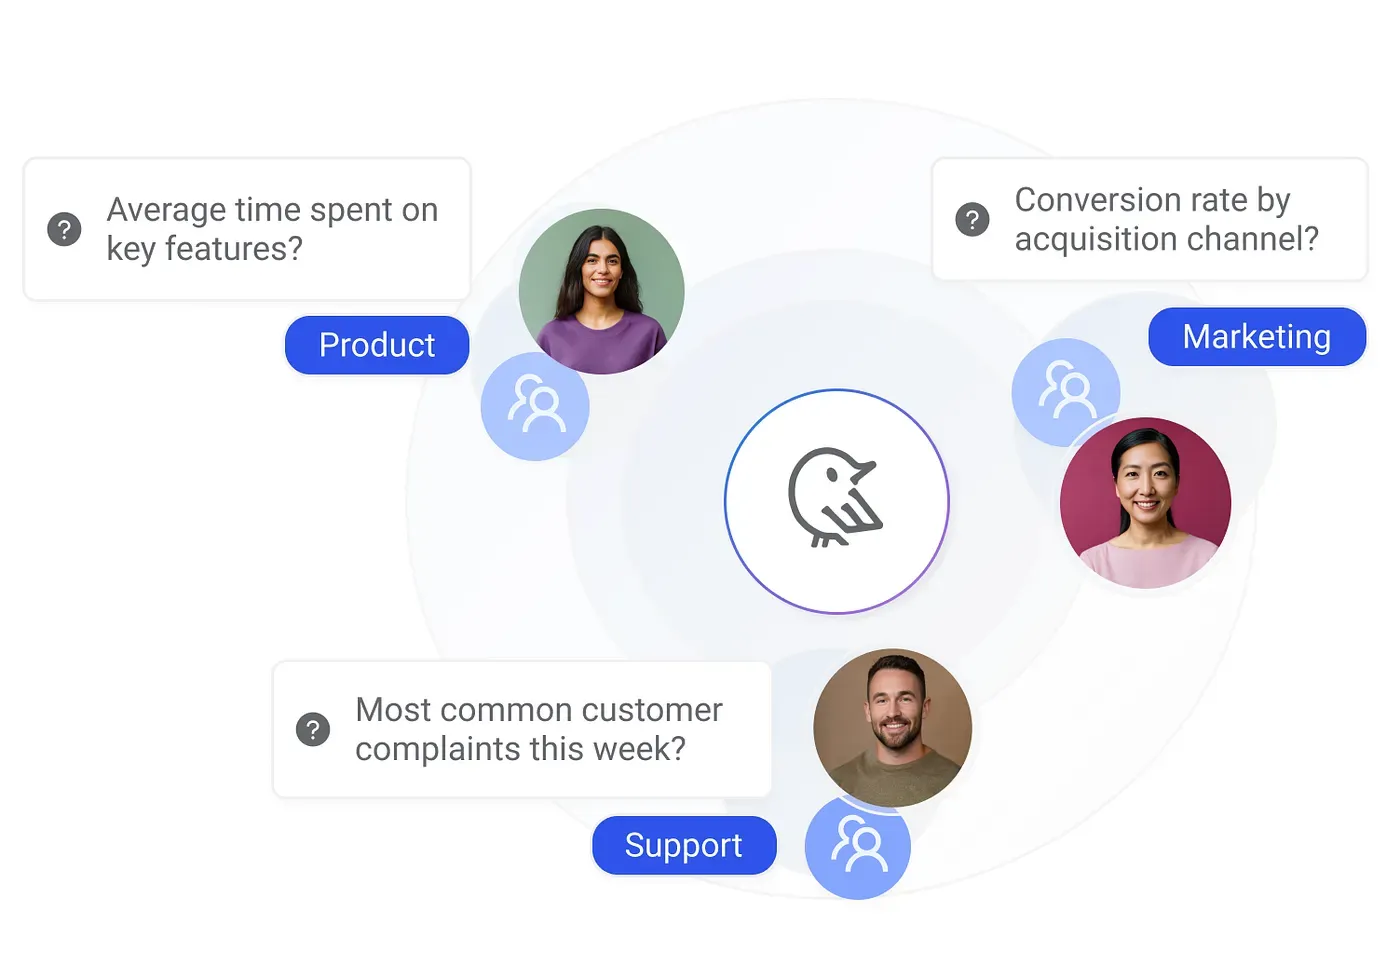
Traditional BI often involves specialized tools and skill sets: data analysts craft SQL queries, BI developers create dashboards, and data engineers manage the ETL/ELT pipelines. This meant that business users — product managers, marketing professionals, or sales executives — had to rely on intermediaries to get the insights they needed. Text-to-SQL tools emerged as a response to this bottleneck, promising to let anyone interact with data directly.
Instead of writing a complex SQL query, a user could simply type:
“Show me total revenue by product category for Q3, and highlight the top five categories.”
A text-to-SQL tool interprets this request, translates it into SQL, and returns the result.
However, there’s a catch: The tool must know what “revenue” means, how products relate to categories, what timeframe Q3 refers to, and what “top five” implies. If your underlying data is a tangled web of cryptically named tables and columns, such as tbl_trx_2023, cust_id_num, cat_desc_var1 — the text-to-SQL engine will struggle. It might misinterpret fields, produce incorrect logic, or fail to return any meaningful result.
This is where traditional data modeling comes into play.
Why Data Modeling Is Still Essential
1. Clarifying Business Concepts
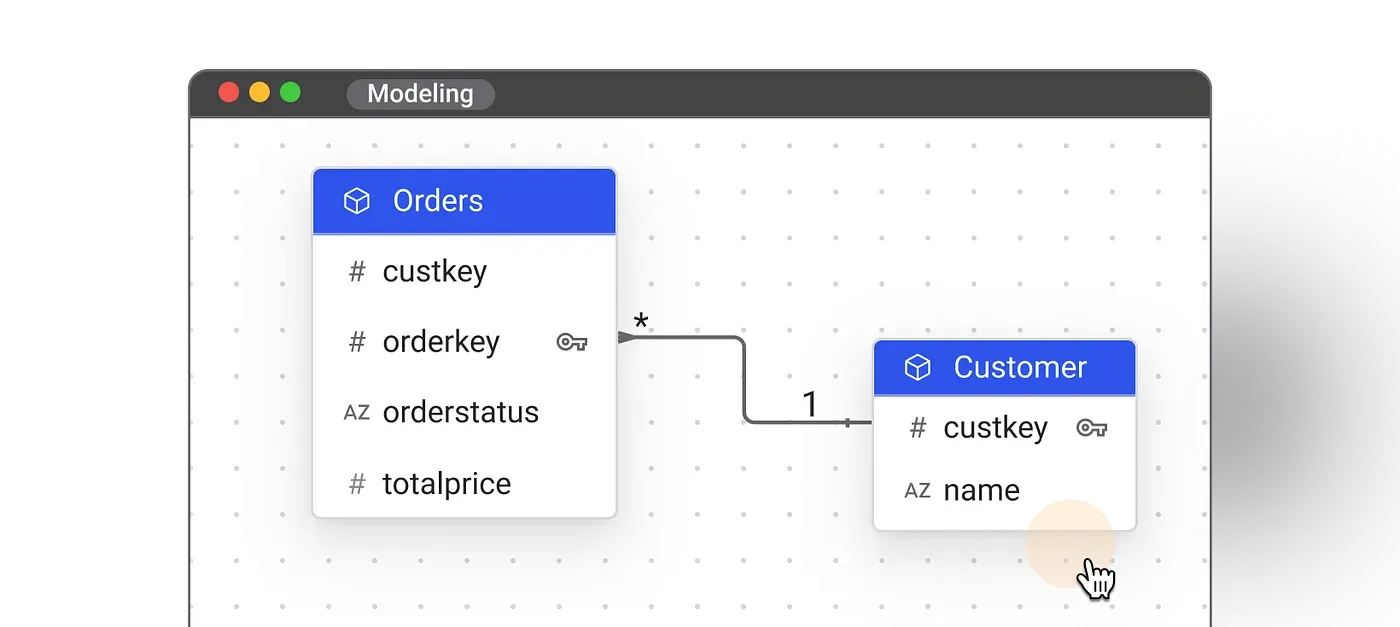
In a traditional BI setup, data modeling transforms raw source tables into business-friendly datasets. For example, let’s say you have a transactional system that stores product sales. Your raw data might be split across multiple tables:
- orders with
order_id,customer_id,product_id,quantity,price - products with
product_id,category_id,sku,description - categories with
category_id,category_name - customers with
customer_id,region,industry
To a database administrator or data engineer, these schemas might be straightforward. But to a business user who just wants to know total revenue by product category, this is not intuitive. In a traditional BI environment, a data modeler would:
• Join these tables logically and create a fact table, fact_sales, with key dimensions linked to dim_products, dim_categories, and dim_customers.
• Rename fields to be more user-friendly: product_category instead of category_name, total_revenue instead of sum(price*quantity).
• Apply consistent definitions: ensure that “revenue” always means sum(quantity * price), and that product categories are standardized.
When you add a Text-to-SQL solution like Wren AI on top, this modeling work ensures that when a user asks, “What was our total revenue by product category last quarter?” the tool can easily map these terms to well-defined, meaningful fields.
2. Semantic Layers and Precomputed Metrics
Traditional BI implementations often include a semantic layer or metadata repository. Tools like Looker, Tableau Data Modeling, or Power BI’s Data Model let developers define measures (like revenue, margin, or churn rate) and dimensions (time, product, region) upfront. By doing so, end-users don’t need to understand raw SQL or complex logic — they can drag-and-drop predefined measures and attributes onto a dashboard canvas.
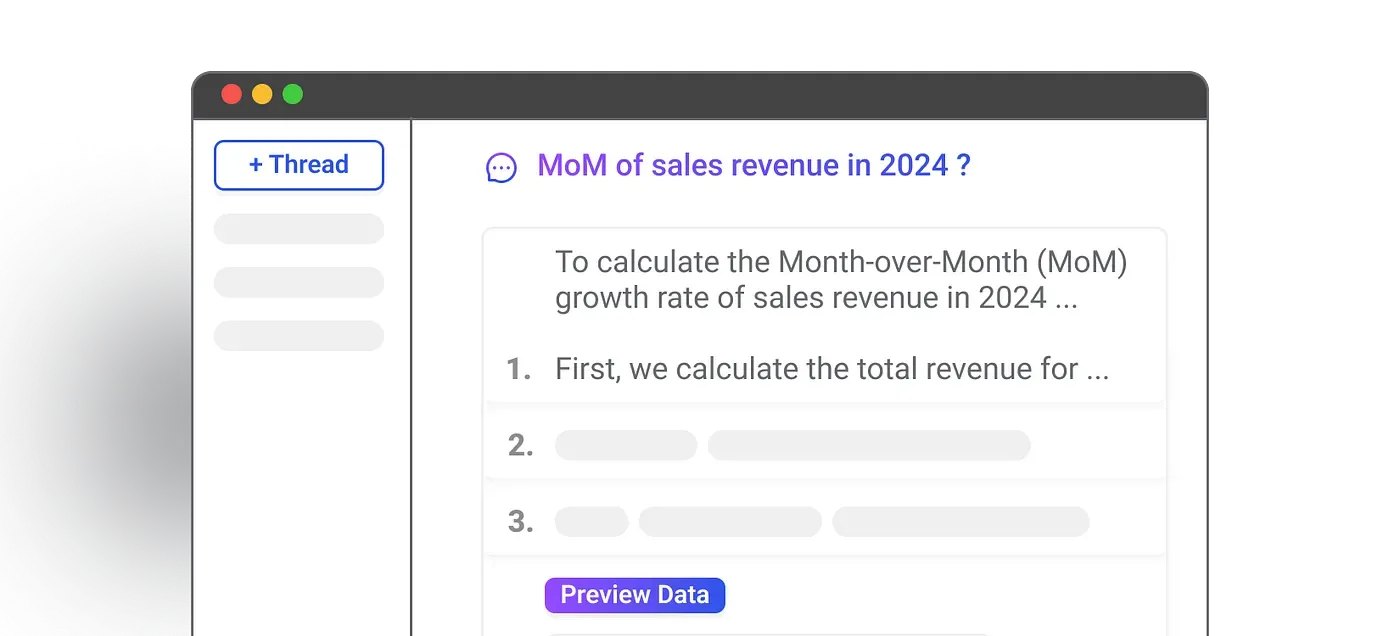
In a Wren AI Text-to-SQL scenario, this semantic layer becomes even more critical. Instead of a dashboard canvas, users have a conversation interface. When they ask for “month-over-month revenue growth,” Wren AI looks to the predefined metric definition and the data model that expresses how month-over-month growth is calculated. Without this, the text-to-SQL system may struggle to correctly infer how to compute growth rates or compare months.
3. Precomputations and Deterministic Datasets
In traditional BI, data engineers often precompute certain metrics or create aggregate tables to speed up queries. For instance, you might build a daily summary table that stores revenue by category and day. By doing this, you eliminate the need to recalculate these totals on the fly every time someone runs a query.
With Wren AI, precomputed and deterministic datasets make natural language querying more accurate. Imagine a user asks:
“Show me the average order value and how it’s changed over the past three months.”
If you’ve already precomputed a table that contains daily or monthly aggregates of average order value, Wren AI can respond quickly and accurately. If not, the tool will have to dynamically compute the logic from raw transactional data, which increases the risk of ambiguity or errors — especially if the raw data isn’t perfectly modeled.
4. Governance and Consistency
One of the principles of a sound data model is governance. By standardizing definitions and ensuring consistent naming conventions, you reduce confusion. Traditional BI projects often involve data governance boards, naming conventions, and careful documentation. These best practices don’t disappear with Wren AI — they become more important.
Why? Because when someone asks Wren AI a question, they rely on well-understood terms. If one team uses “revenue” to mean net sales minus returns, and another team uses “revenue” to mean gross sales, the system needs to know which definition to use. Data modeling and governance ensure that such definitions are standardized, creating a single source of truth that Wren AI can reference confidently.
Borrowing from Traditional BI: Examples That Apply to Wren AI
Let’s consider some typical scenarios from a traditional BI implementation and how they map to setting up Wren AI.
Scenario 1: Sales Reporting
Traditional BI Approach:
- The data modeler creates a
fact_salestable that includesdate_key,product_key,customer_key, and measures such assales_amountandquantity_sold. dim_date,dim_product, anddim_customertables standardize how dates, products, and customers are represented.- The BI tool references these dimensions and facts to create dashboards showing revenue over time, top products, or top customers.
Wren AI Approach:
- Before plugging in Wren AI, ensure your
fact_salesanddim_producttables are stable, well-defined, and contain all the standard metrics your business cares about. - Precompute logic where beneficial: For example, a
fact_daily_revenuetable that aggregates total sales by date and product category. - With these datasets in place, when a user asks, “Show me last month’s top five product categories by revenue,” Wren AI can map “last month” to a filter on
date_key, “revenue” tosales_amount, and “product categories” to thedim_categorytable, returning immediate, correct results.
Scenario 2: Customer Segmentation and Churn Analysis
Traditional BI Approach:
- Analysts define what “churn” means: a customer who hasn’t purchased in the last 90 days, for example.
- They create a
fact_customer_activitytable with precomputed flags or metrics that identify whether a customer is active or churned each month. - Reports in the BI tool let users filter customers by churn status, segment them by region or industry, and analyze changes over time.
Wren AI Approach:
- Incorporate the churn definition into your semantic model. Precompute a column
churned_customeras a boolean or a segment label in your data pipeline. - When a user asks, “How many customers churned last quarter compared to the previous quarter?” Wren AI can look up the
churned_customerflag and time dimensions to deliver an accurate result. - Without this predefinition, Wren AI would have to guess what churn means, leading to inconsistent or incorrect results.
Scenario 3: Inventory and Supply Chain KPIs
Traditional BI Approach:
- Data engineers build a
fact_inventorytable to track stock levels, reorder points, and backorders. - A
dim_productanddim_supplierhelp relate products to suppliers, and adim_dateprovides a temporal dimension. - Analysts precompute metrics like “
stockout_rate” or “average_lead_time” in a separate aggregate table.
Wren AI Approach:
- Continue to rely on these precomputations and well-modeled tables.
- For example, if you have a table
fact_inventory_aggthat stores daily inventory levels and stockout counts, Wren AI can instantly answer: “What was our stockout rate for supplier X last week?” - If you didn’t define and precompute “stockout rate” (perhaps it’s
stockout_count / total_items_sold), Wren AI would have to try inferring it from raw tables, which may lead to confusion.
Why Storing Data in a Structured Database Isn’t Enough
A common misconception is that if your data is already in a relational database, you’re set. But a raw relational schema is often designed for transaction processing, not for business intelligence. Tables might be normalized in complex ways or named in developer-friendly terms rather than business terms. Foreign keys and relationships may exist but be unclear to a non-technical user.
Wren AI’s strength is natural language querying — not magically deducing your business rules from cryptic schemas. By transforming raw tables into business-oriented datasets, you reduce the cognitive load on the text-to-SQL engine. When columns and tables have meaningful names — sales_amount instead of col_x56, product_category instead of cat_desc_var1 — Wren AI can map user intent to data elements more effectively.
Additionally, precomputing logic in your transformation pipeline removes ambiguity. If you know you always measure “last quarter’s revenue” as the sum of sales between the first and last day of the previous quarter, you can store these aggregates in a table keyed by quarter. Wren AI then simply applies filters to the correct dataset. This precomputation ensures self-service users get accurate results without needing to wrestle with definitions or raw data every time.
Practical Tips for Getting the Most Out of Wren A
1. Start with a Strong ETL/ELT Foundation
Your pipeline should already be extracting, transforming, and loading data into a well-organized schema. Take the time to rename columns, clean up data anomalies, and join related tables. Just as traditional BI tools benefit from clean, modeled data, so does Wren AI.
2. Implement a Robust Semantic Layer
If your organization used LookML in Looker, Data Models in Power BI, or semantic layers in Tableau, the same principles apply. Define your metrics, dimensions, and hierarchies in a way that aligns with your business. For instance, store “Annual Recurring Revenue (ARR)” in a separate metric table or tag it as a known measure. Wren AI can then pick up “ARR” easily when users query it.
3. Precompute Common Metrics
Identify the top queries and metrics your business users frequently ask for. Do they often analyze monthly recurring revenue, average order value, churn rate, or conversion rates? Precompute these in your data pipeline. This could mean creating aggregate tables keyed by time periods, customer segments, or product categories. The result: faster, more deterministic answers from Wren AI.
4. Standardize Business Logic and Terminology
Data modeling includes enforcing consistent naming conventions and documentation. Make sure you have a data dictionary that explains what each metric and dimension means. This dictionary can guide both technical implementers and serve as a reference when users interact with Wren AI. The more consistent your terminology, the easier it is for Wren AI to interpret queries correctly.
5. Iterate and Refine Based on Feedback
When you first deploy Wren AI, observe how users interact with it. Are they asking questions that don’t map cleanly onto your model? Maybe you need to add a new semantic definition or precompute a different metric. Just as with traditional BI, the data model evolves as the business changes. Continuously refining your model ensures Wren AI remains accurate and valuable.
Transforming Traditional BI into a Natural Language Experience
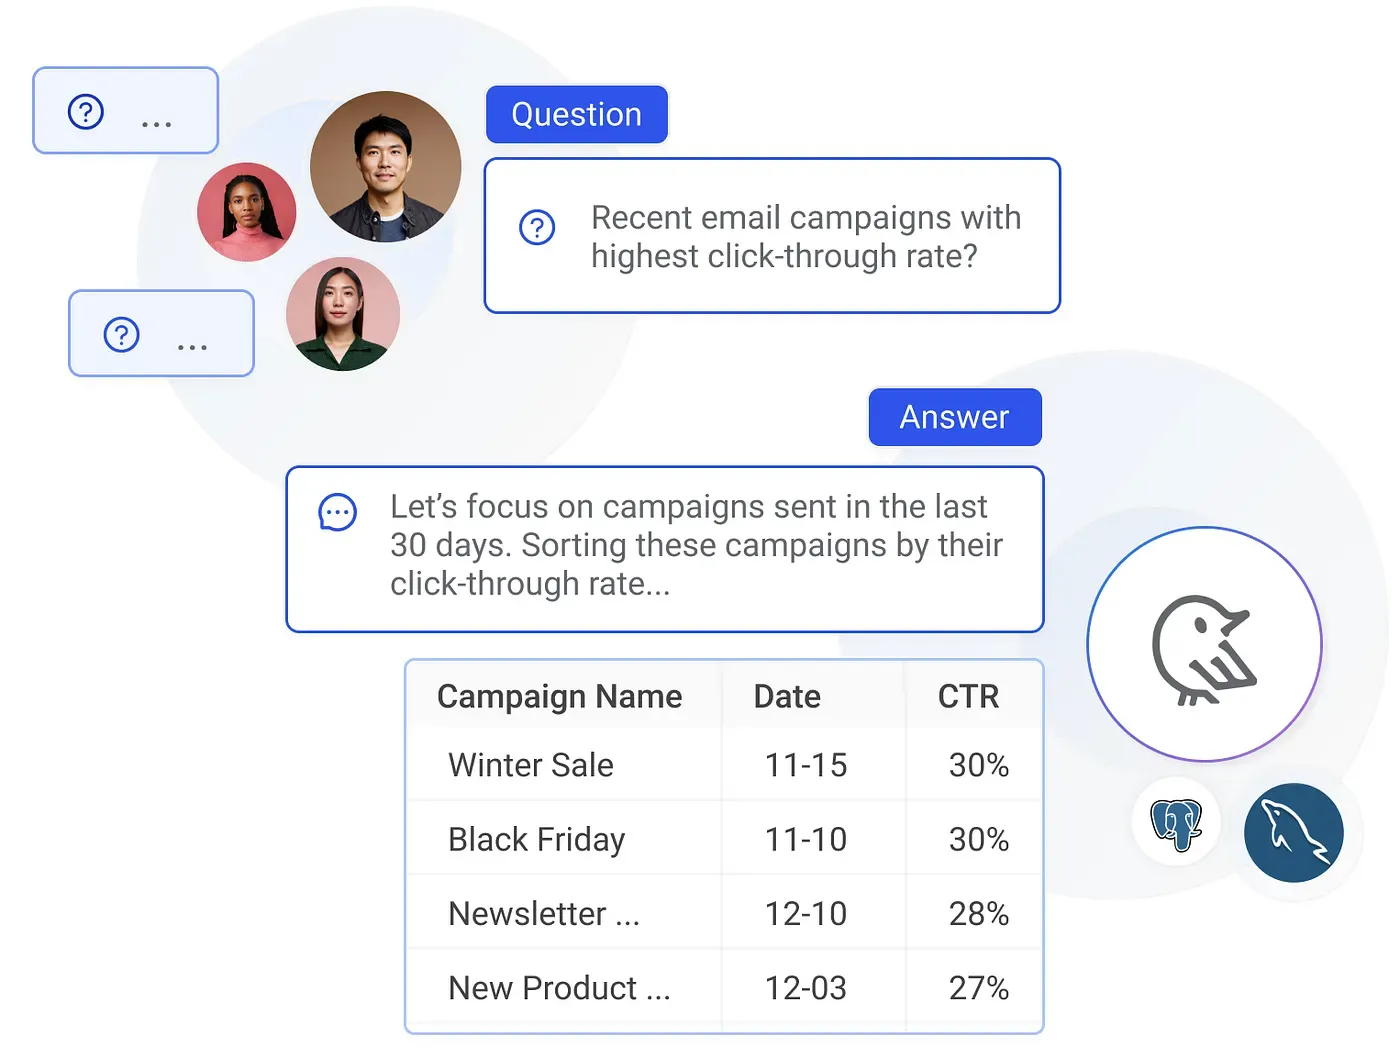
Instead of viewing text-to-SQL and data modeling as opposing forces, think of them as complementary. Traditional BI practices — ETL/ELT pipelines, semantic layers, data marts, and aggregate tables — set the stage for Wren AI to deliver on its promise of accessible analytics.
By building on proven data modeling techniques, Wren AI becomes your next-generation BI interface, empowering anyone to tap into curated, well-defined data. Rather than a collection of confusing tables, your analytics environment is a set of rich, meaningful datasets that Wren AI can navigate with ease.
Data Modeling Is Alive and More Important Than Ever
Text-to-SQL solutions like Wren AI have not killed data modeling; they’ve elevated its importance. These new tools rely on the hard work that has always fueled effective BI — clean, well-structured data models, predefined business logic, semantic layers, and precomputed metrics.
- Without data modeling, Wren AI struggles with ambiguous terminology, inconsistent definitions, and unclear relationships.
- With data modeling, Wren AI thrives, translating natural language questions into accurate insights against your carefully prepared datasets.
In other words, data modeling isn’t dead; it’s the essential backbone that allows text-to-SQL interfaces to shine. By combining the wisdom of traditional BI implementations — such as ETL pipelines, semantic layers, and metric definitions — with the cutting-edge capabilities of Wren AI, you can create a seamless, self-serve analytics experience that’s both user-friendly and enterprise-grade.
Key Takeaways:
- Text-to-SQL tools excel when built on top of well-modeled, business-oriented data.
- Precompute common metrics, define consistent business logic, and organize data into intuitive schemas.
- Borrow best practices from traditional BI — semantic layers, data governance, and aggregate tables — to give Wren AI the context it needs.
- Continuously refine your data model as business needs evolve, ensuring that natural language querying remains a reliable path to insight.
Ultimately, data modeling remains the blueprint that guides your organization from raw information to actionable knowledge. By leveraging Wren AI on top of that strong foundation, you combine the best of both worlds: the rigor and reliability of traditional BI with the accessibility and convenience of natural language queries.
If you haven’t tried out the magic of a semantic-first text-to-SQL solution that can transform your analytics experience, we invite you to explore Wren AI 🙌.
You can also dive into our open-source offering on Wren AI OSS on GitHub 😍and start building a more intuitive, future-proof data environment today.
Supercharge Your
Data with AI Today
Join thousands of data teams already using Wren AI to make data-driven decisions faster and more efficiently.
Start Free TrialRelated Posts
Related Posts

Beyond Text-to-SQL: Why Feedback Loops and Memory Layers Are the Future of GenBI
How Wren AI’s Innovative Approach to Question-SQL Pairs and Contextual Instructions Delivers 10x More Accurate Generative Business Intelligence
Fueling the Next Wave of AI Agents Building the Foundation for Future MCP Clients and Enterprise Data Access
How Wren Engine Powers the Semantic Layer for AI-Driven Workflows — Unlocking Context-Aware Intelligence Across the MCP Ecosystem
How we design our semantic engine for LLMs? The backbone of the semantic layer for LLM architecture.
The advent of Trend AI agents has revolutionized the landscape of business intelligence and data management. In the near future, multiple…

