What is GenBI? Get Your First Dashboard Done in 3 Clicks
GenBI: The Future of Business Intelligence, Create Data-Driven Dashboards in 3 Clicks

Howard Chi
Updated: Dec 18, 2025
Published: Feb 07, 2025
To understand GenBI's significance, it’s helpful to reflect on where we’ve come from. Traditional BI tools revolutionized how organizations approached data by offering structured ways to visualize trends, generate reports, and create dashboards. They provided clarity in the chaos of raw numbers. However, these tools often had limitations: they were static, required technical expertise, and lacked the agility to adapt to rapidly changing business questions.
Consider a marketing manager needing to analyze campaign performance. With traditional BI, they would rely on data analysts to write queries, generate reports, and build dashboards, a process that could take days or even weeks. By the time insights were delivered, the window for action might have already closed.
GenBI flips this model upside down. It introduces a dynamic, AI-driven approach in which insights are generated on the fly, dashboards are created with a click, and data analysis becomes an interactive, real-time experience. This shift from static to generative isn’t just about speed; it’s about empowering decision-makers at every level to engage directly with their data.
Defining GenBI: What Makes It Different?
At its core, Generative Business Intelligence is about leveraging AI to automate and enhance the process of data analysis. Instead of relying on pre-built dashboards or static reports, GenBI systems generate insights dynamically based on the questions users ask in natural language.
Traditional BI systems often fall short because they come with steep learning curves, require extensive manual intervention, and generate static reports that don’t adapt to changing business needs. A non-technical user looking for insights into last quarter’s top-performing products might struggle navigating complex dashboards or waiting days for analysts to provide SQL-driven reports.
With GenBI, that same user can simply ask, “What were our top-performing products last quarter, and what factors contributed to their success?” and receive an AI-generated dashboard on the fly. Not only does GenBI produce real-time charts and contextual analysis, but it also uncovers hidden patterns and relationships that traditional BI tools might overlook. The system eliminates the need for SQL queries, accelerates decision-making, and integrates multiple data sources into a unified view, empowering teams to act on insights immediately.
How Does GenBI Work?
The magic of GenBI lies in the seamless integration of several advanced technologies:
- Natural Language Processing (NLP): This allows users to interact with data using everyday language. No need for complex SQL queries or technical jargon.
- AI-Driven Query Generation: The system translates natural language questions into optimized queries that fetch relevant data from connected sources.
- Automated Visualization: Instead of static reports, GenBI generates dynamic dashboards, charts in one click, based on your questions and intentions GenBI will generate the most optimal presentation for your results.
- Continuous Learning: The more you use it, the smarter it gets. GenBI learns from user interactions to refine its responses and recommendations.
0_Fk13F7ofd2mRH7J_.webp
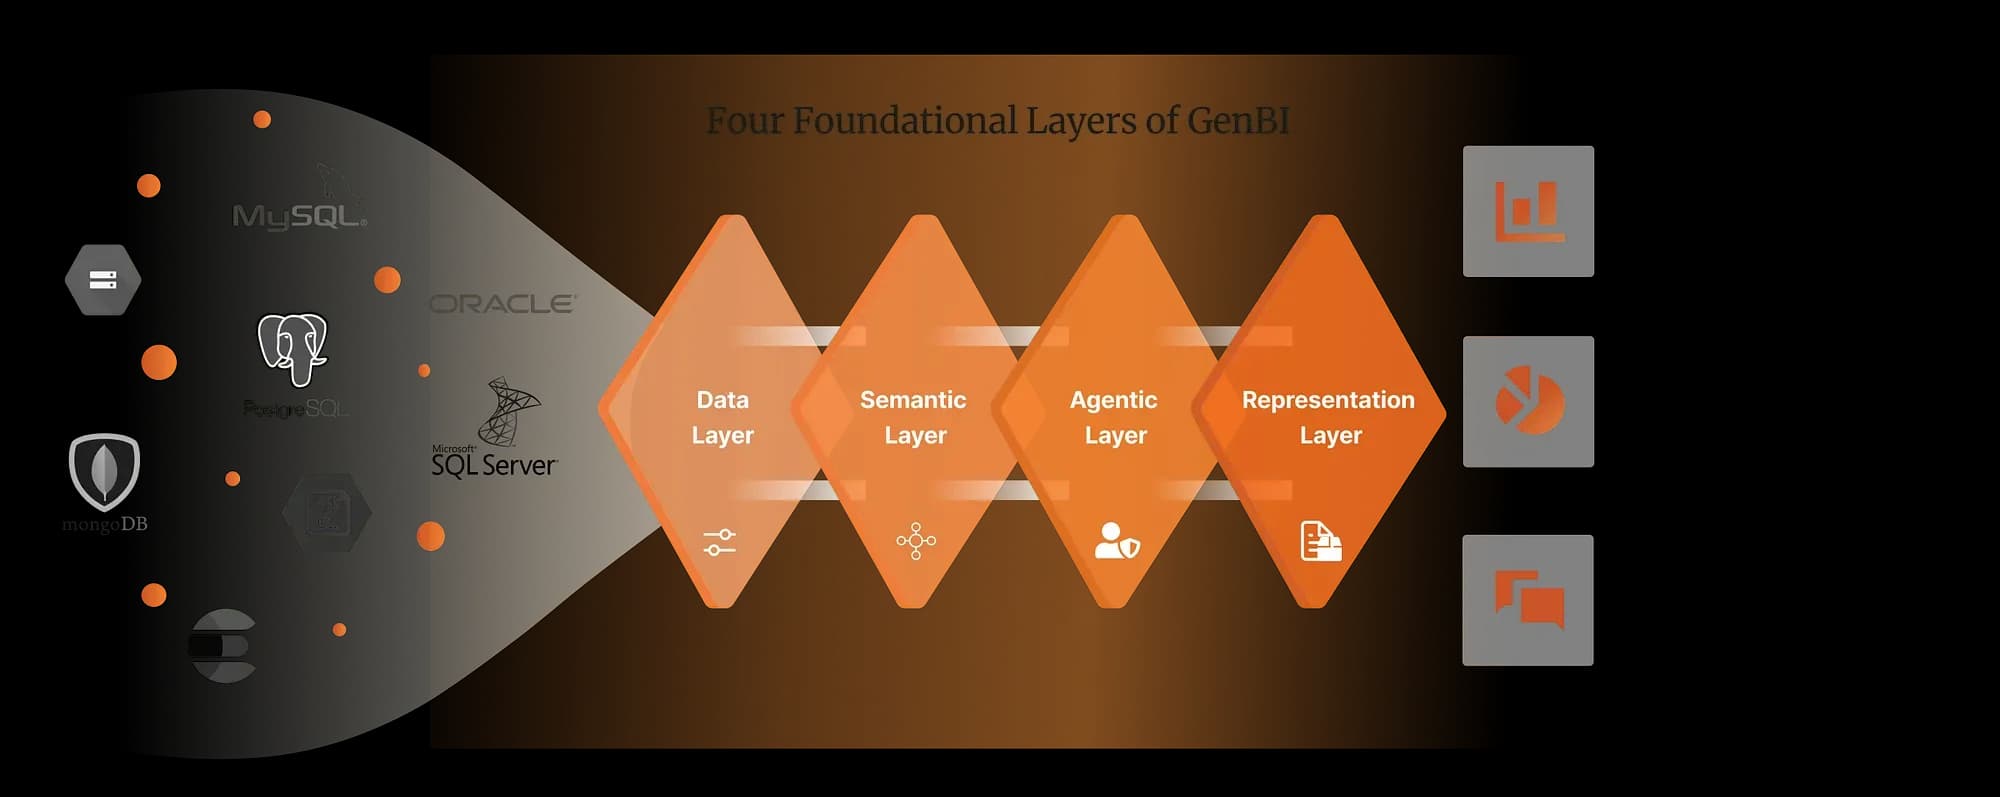
Four Foundational Layers of GenBI, please check the AI-Powered Business Intelligence: The Complete Guide to GenBI to learn more.
This isn’t just automation; it’s intelligence in action. GenBI doesn’t replace human insight; it amplifies it, freeing up time and mental bandwidth to focus on strategic decisions.
Get Started With GenBI. What Is Wren AI?
Wren AI is an advanced Generative BI platform designed to simplify data analysis for everyone, no technical expertise required. It allows users to access, analyze, and visualize their data instantly by simply asking questions in plain language. Whether you’re a marketer tracking campaign performance, a product manager analyzing user behavior, or a finance executive monitoring revenue trends, Wren AI transforms the way you interact with your business data. It’s built on a governed semantic layer, a context layer that defines your metrics and business logic once, so answers stay consistent and trustworthy, not just fast.
Introducing Wren AI
Build Your First Dashboard in 3 Clicks
Getting started with Wren AI is incredibly simple. You can create a complete dashboard in just three easy steps:
Step 1: Ask a Question in Plain Language
After connecting your data in Wren AI Cloud. Forget SQL queries and complex filters. With Wren AI, you can simply type your question in natural language. For example:
- “What were our top-selling products last quarter?”
- “Show me a breakdown of website traffic by source over the past month.”
- “Compare revenue growth across different regions.”
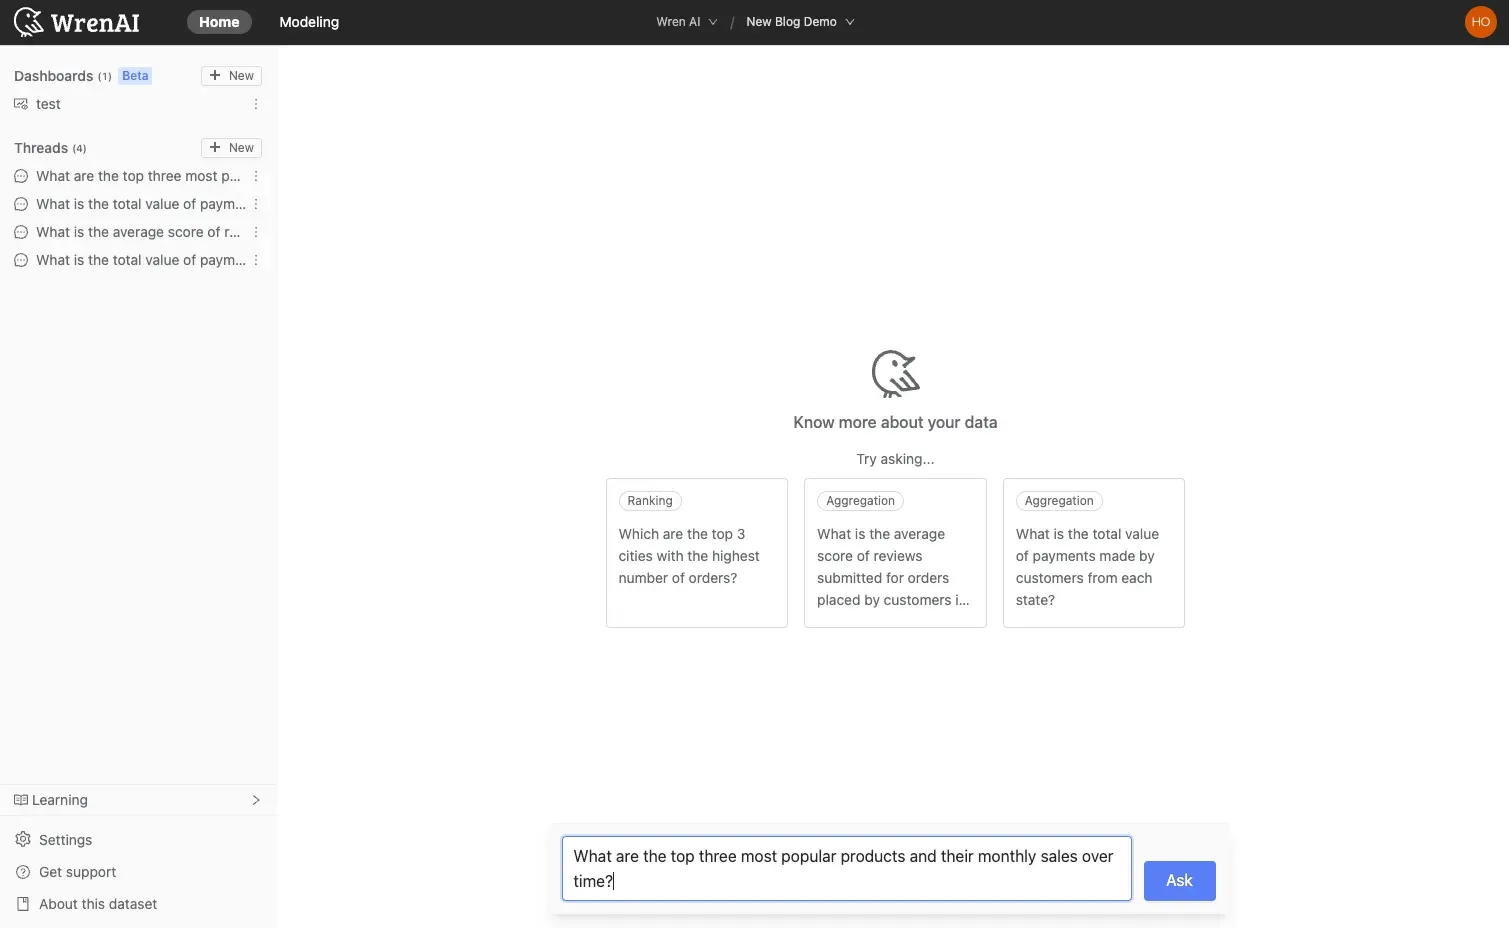
1_mLrHLRPLDdP1V8-3ABBXtg.webp
Type in your question in the the input box, and click “Ask”
The AI instantly understands your intent and translates it into a structured query, retrieving the relevant data from your connected sources.
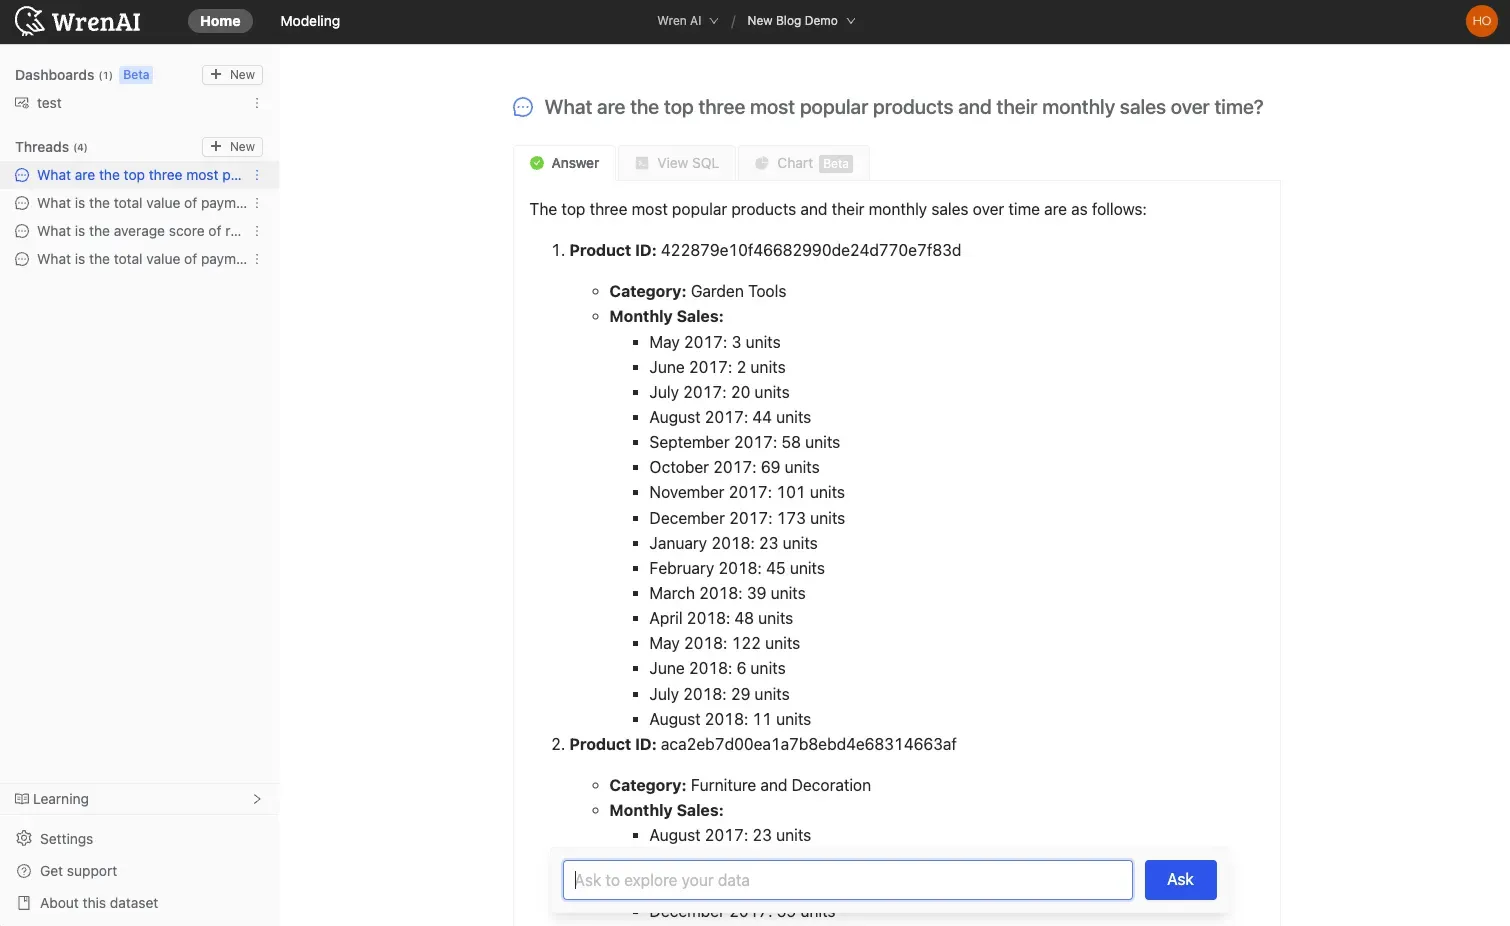
You can either just check the answer, or review the SQL to see how Wren AI generated it from your question.
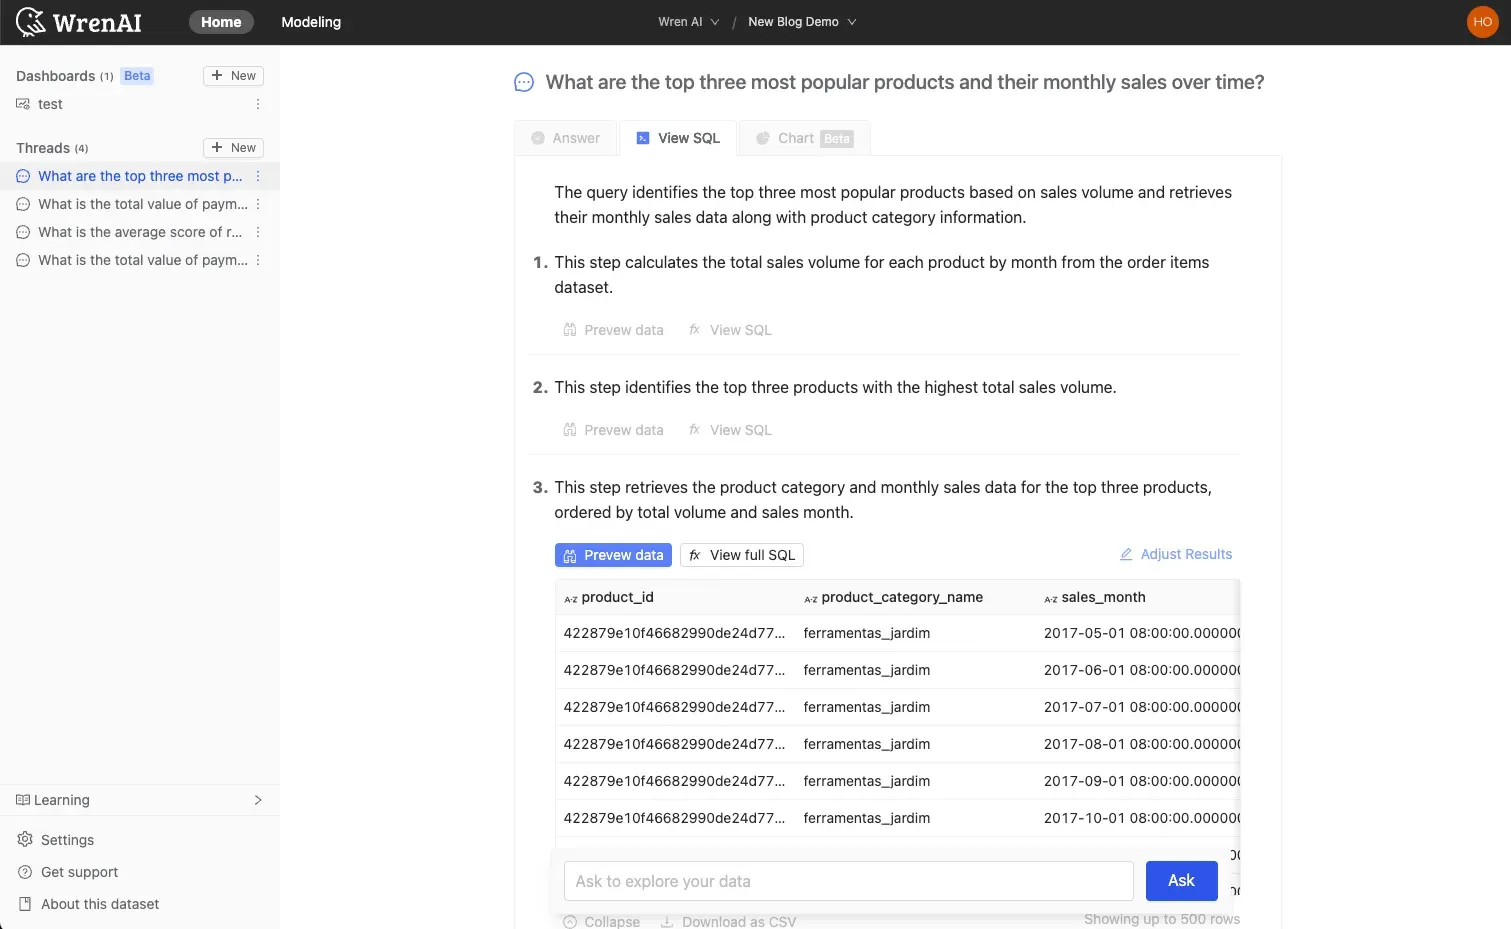
Step-by-step review of how the data has been generated.
Step 2: Click ‘Generate Chart’
Once you’ve asked your question, Wren AI automatically generates the most relevant visualization for your data. Whether it’s a bar chart, line graph, pie chart, group bar chart, line chart, multi-line chart, etc, the AI intelligently selects the best format to present your insights in the clearest way possible.
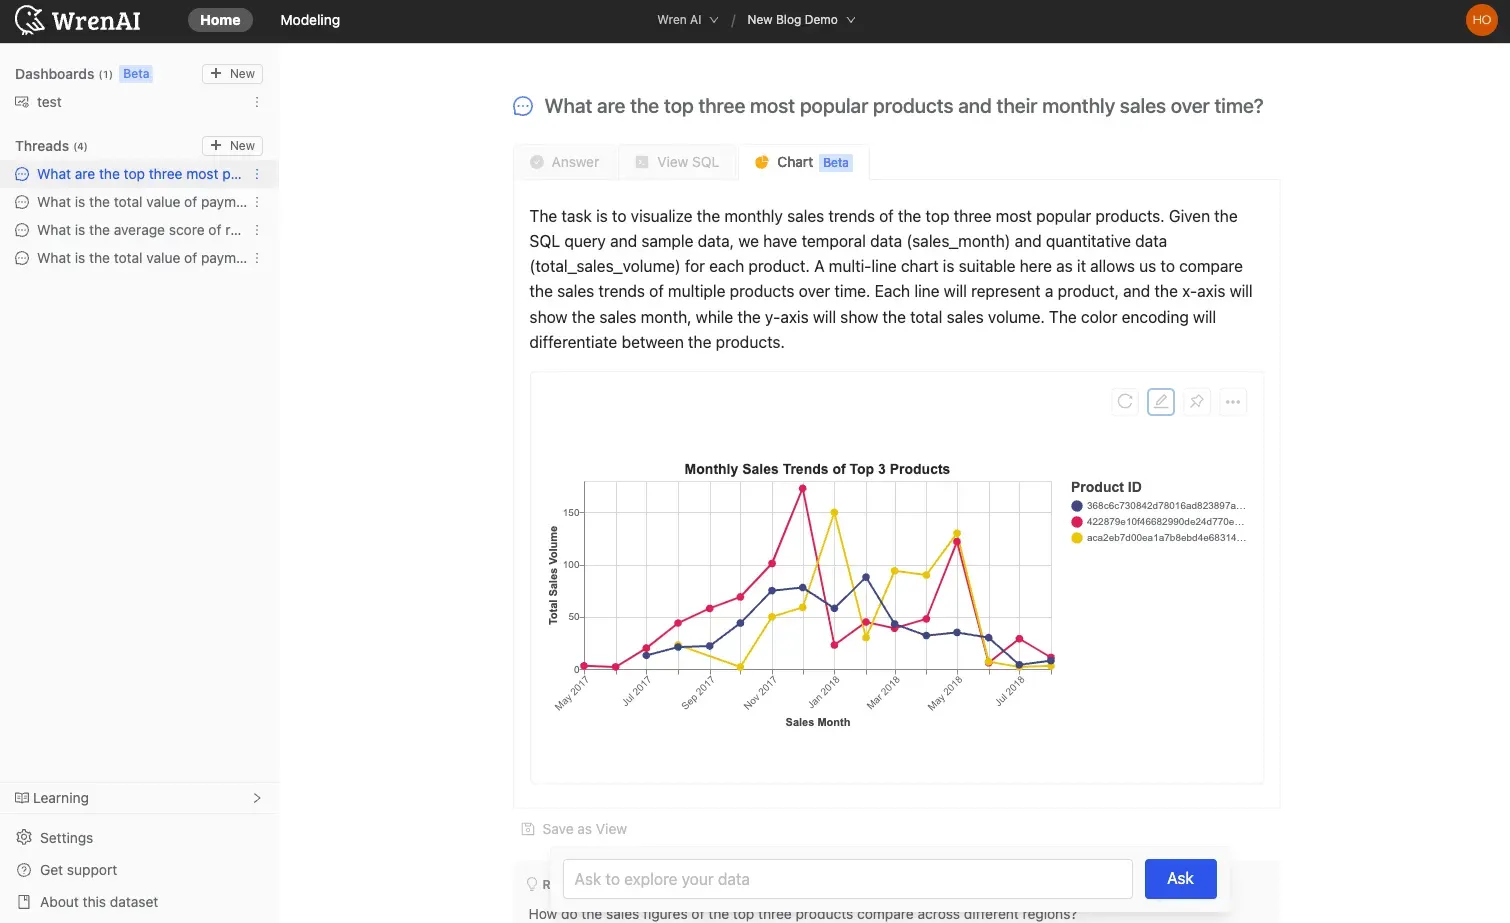
Click the “Chart” button to get the visualized result
You can also edit the chart for your preference
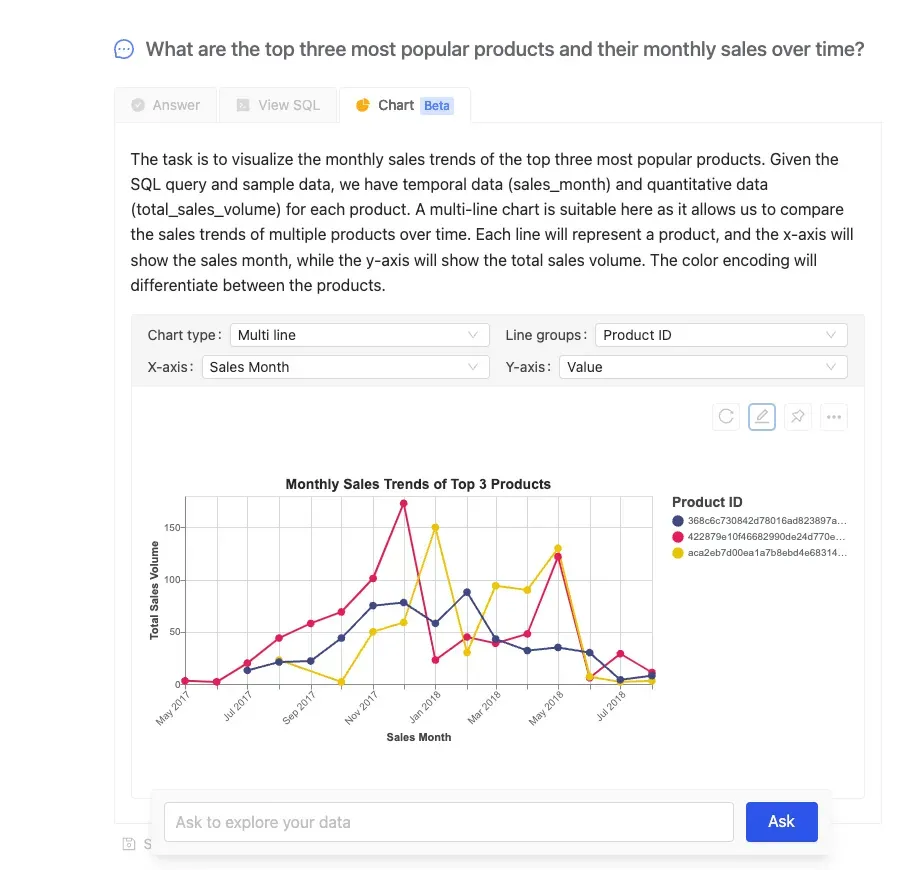
Click the “Edit” Icon to modify for your personal need.
Step 3: Pin to Dashboard
With a single click, you can pin your newly generated charts to a dashboard. This allows you to track key metrics in real time, revisit insights, and share them with your team, without needing to rebuild reports from scratch.
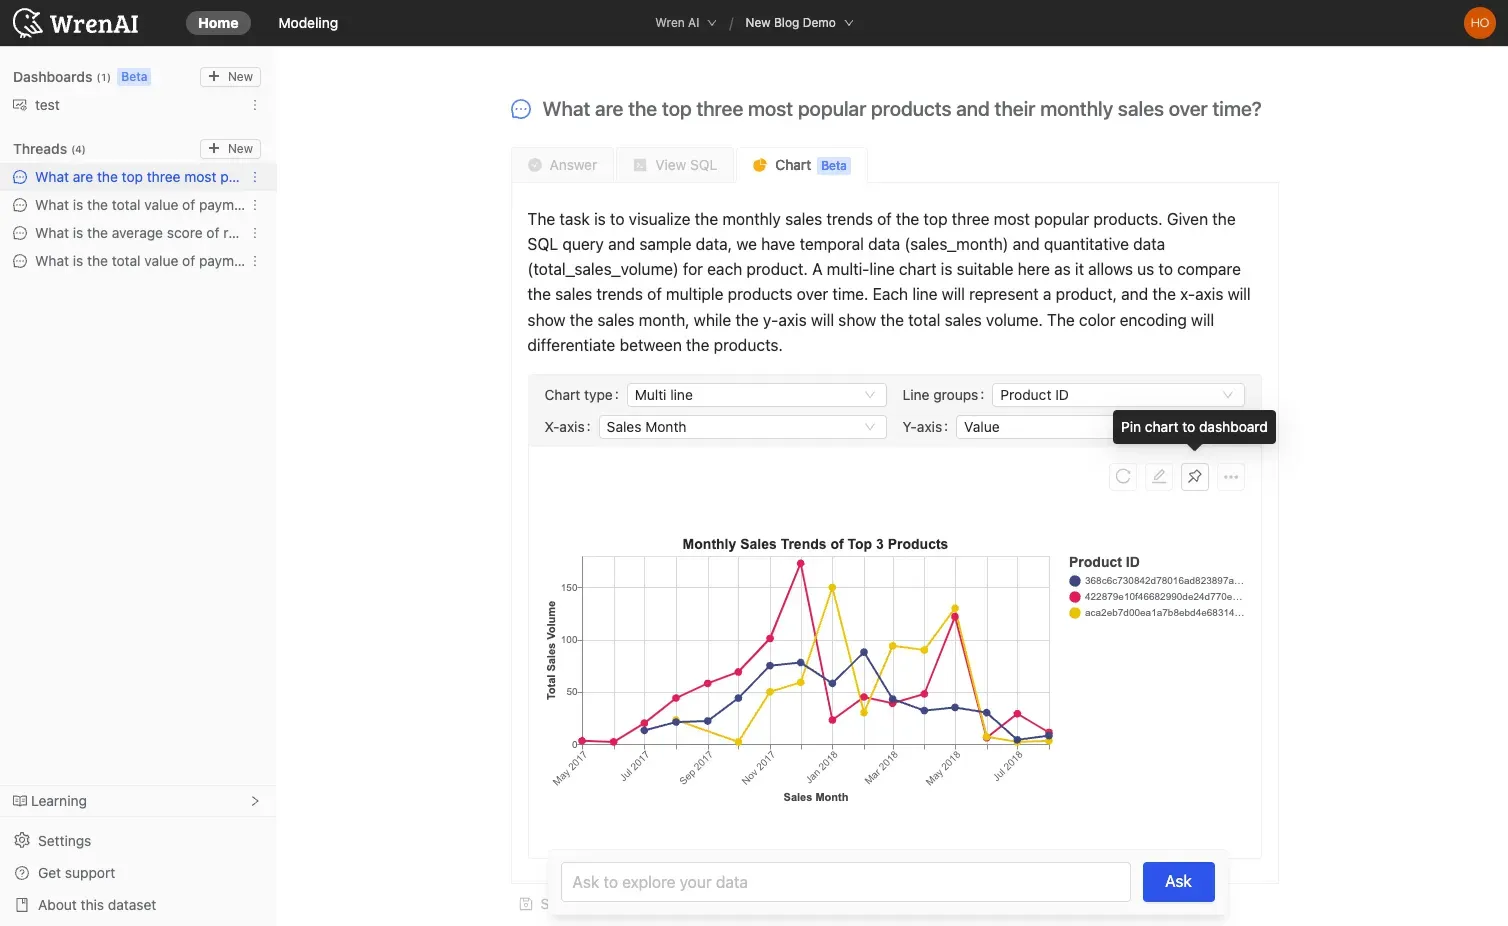
Click the “Pin” Icon to pin to your dashboard
You can also “pin” multiple charts into one dashboard, drag-and-drop and resize it based on your preference.
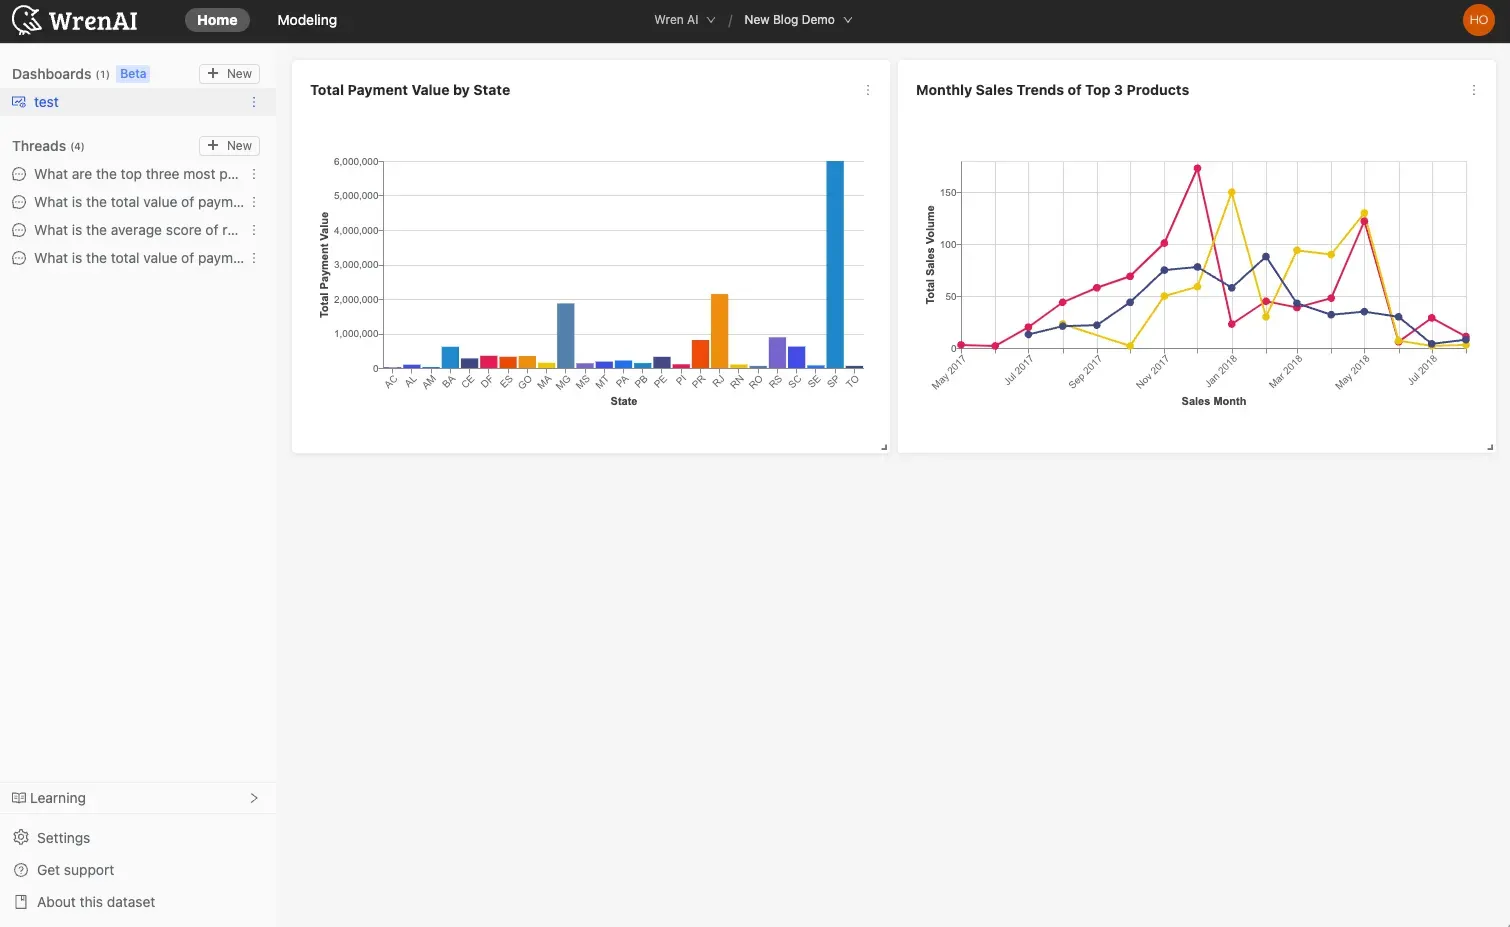
Now you have a “Dashboard” that you can revisit anytime
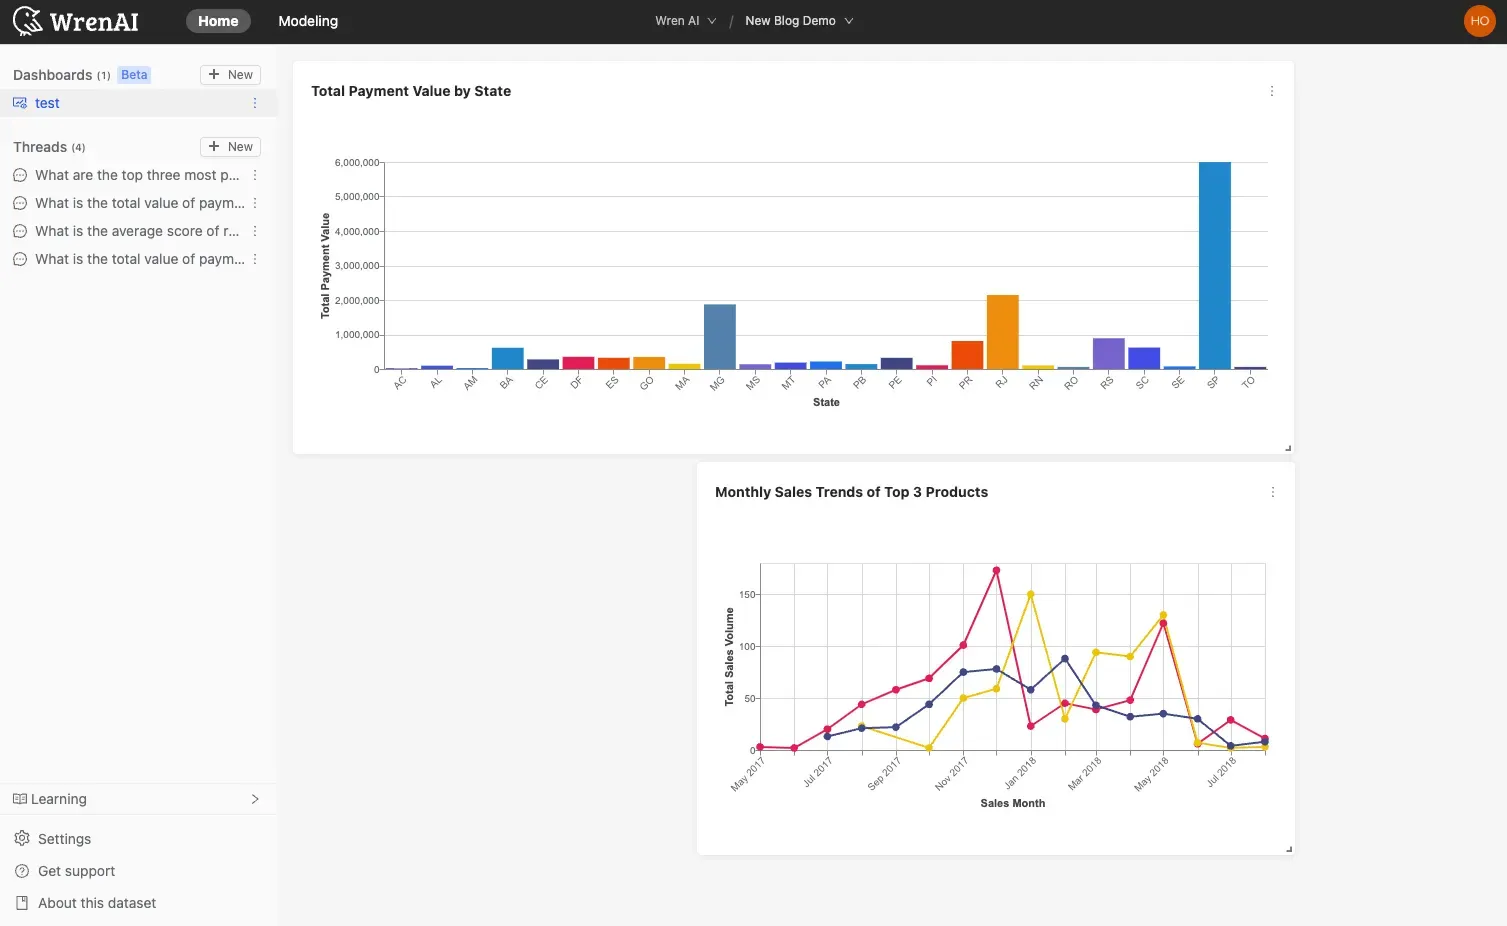
You can place charts based on your preferences.
Why GenBI Matters
The power of GenBI, and specifically Wren AI, lies in its ability to democratize data. No longer do you need to wait for analysts or struggle with complicated BI tools, anyone in your organization can generate meaningful insights in seconds. By streamlining data workflows, GenBI enables businesses to make faster, smarter, and more data-driven decisions.
Are you ready to experience the future of business intelligence? Try Wren AI today and build your first dashboard in just three clicks!
Supercharge your data with AI today
Join thousands of data teams already using Wren AI to make data-driven decisions faster and more efficiently.
Start Free TrialRelated Posts
How Wren AI Agent Supercharges the Future of Marketing Measurement Platforms
Marketing Measurement Platforms (MMPs) are pivotal for performance marketers seeking to unify data and fuel more innovative campaign strategies.
Jun 26, 2025How AI-Powered Analytics Transformed a Brokerage’s Trading Platform
GenBI Delivers 10x Faster Data Insights for Crypto Trading Firms Using Natural Language Queries
Jul 03, 2025Less Waiting, More Winning How Smart Marketing Agencies Use AI to Drive Results Faster
Replace slow BI dashboards with conversational analytics. Ask questions in plain English and get CTR, CPC, and ROAS metrics visualized in seconds.

Keep reading
 Insight
How Wren AI Agent Supercharges the Future of Marketing Measurement Platforms
Marketing Measurement Platforms (MMPs) are pivotal for performance marketers seeking to unify data and fuel more innovative campaign strategies.
 Product
How AI-Powered Analytics Transformed a Brokerage’s Trading Platform
GenBI Delivers 10x Faster Data Insights for Crypto Trading Firms Using Natural Language Queries
 Product
Less Waiting, More Winning How Smart Marketing Agencies Use AI to Drive Results Faster
Replace slow BI dashboards with conversational analytics. Ask questions in plain English and get CTR, CPC, and ROAS metrics visualized in seconds.