Tutorial
How We Closed the Profitability Gap by Talking to Our Logistics Data
Stop guessing. In a game of minutes and margins, the platform that understands its data best will win. Traditional dashboards only show you the problem; they don't give you the solution. See how teams are using conversational AI to move beyond static reports, pinpoint the real bottlenecks, and turn data into immediate, actionable strategy.
Pin Chang
Updated: Oct 24, 2025
Published: Oct 24, 2025
In the hyper-competitive world of logistics, victory is measured in minutes and margins. Every delivery platform is in a constant race against the clock, traffic, and customer expectations. To navigate this complex landscape, we've armed our operations teams with dashboards - beautiful, intricate displays of our logistics performance.
We build our dashboards to give us a bird's-eye view, starting with the essentials:
1. What is our overall performance at a glance?
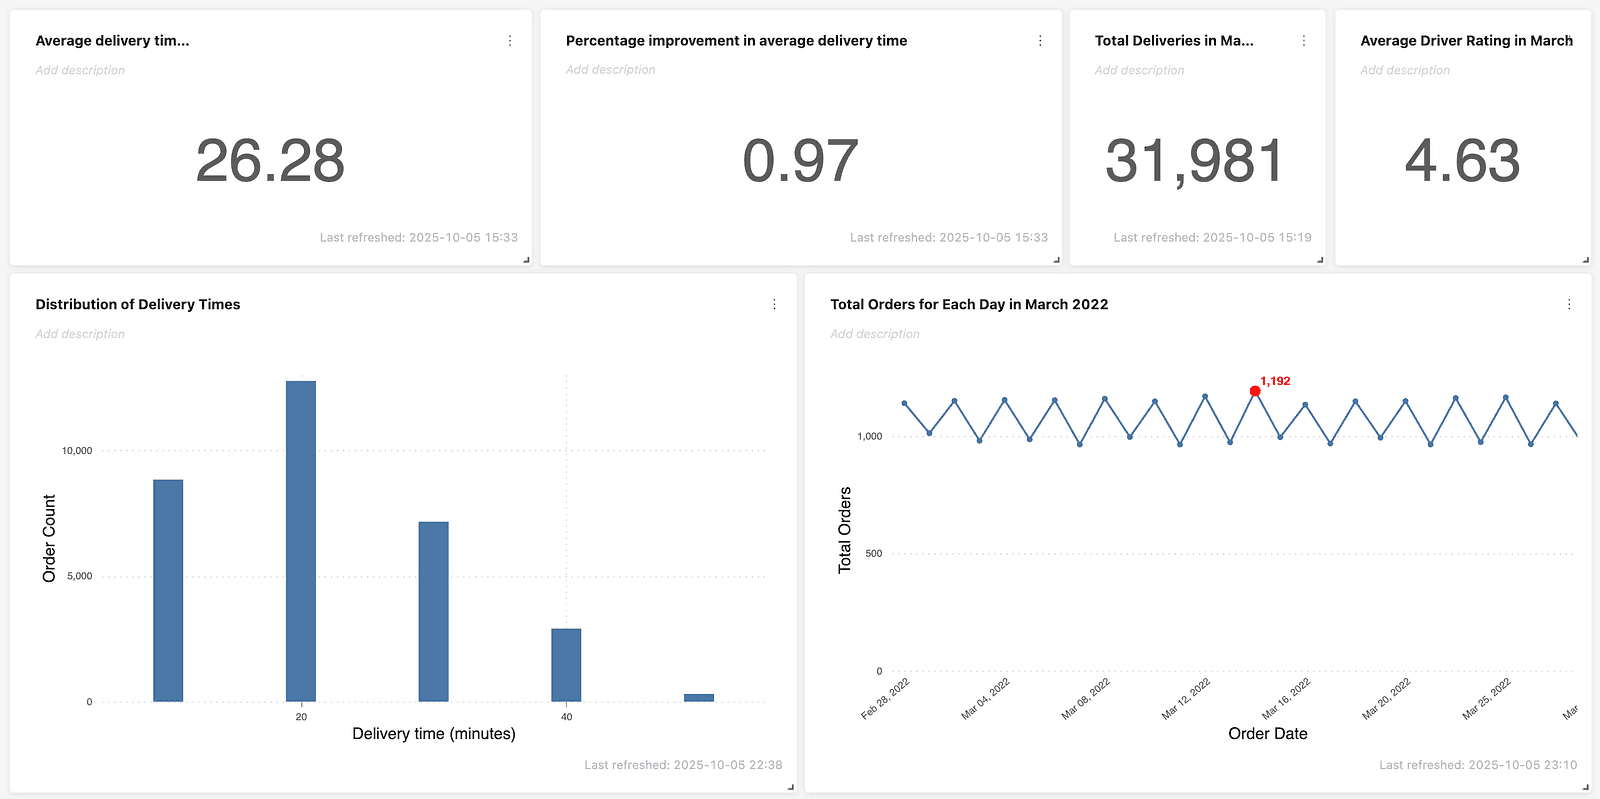
At the top, we showcase our Key Performance Indicators (KPIs) that tell us whether we're winning or losing: Average Delivery Time (minutes): Our North Star metric. Improvement in Average Delivery Time (%): Tracks our operational progress. Total Deliveries: Reflects overall business volume. Average Driver Rating: A live indicator of customer satisfaction.
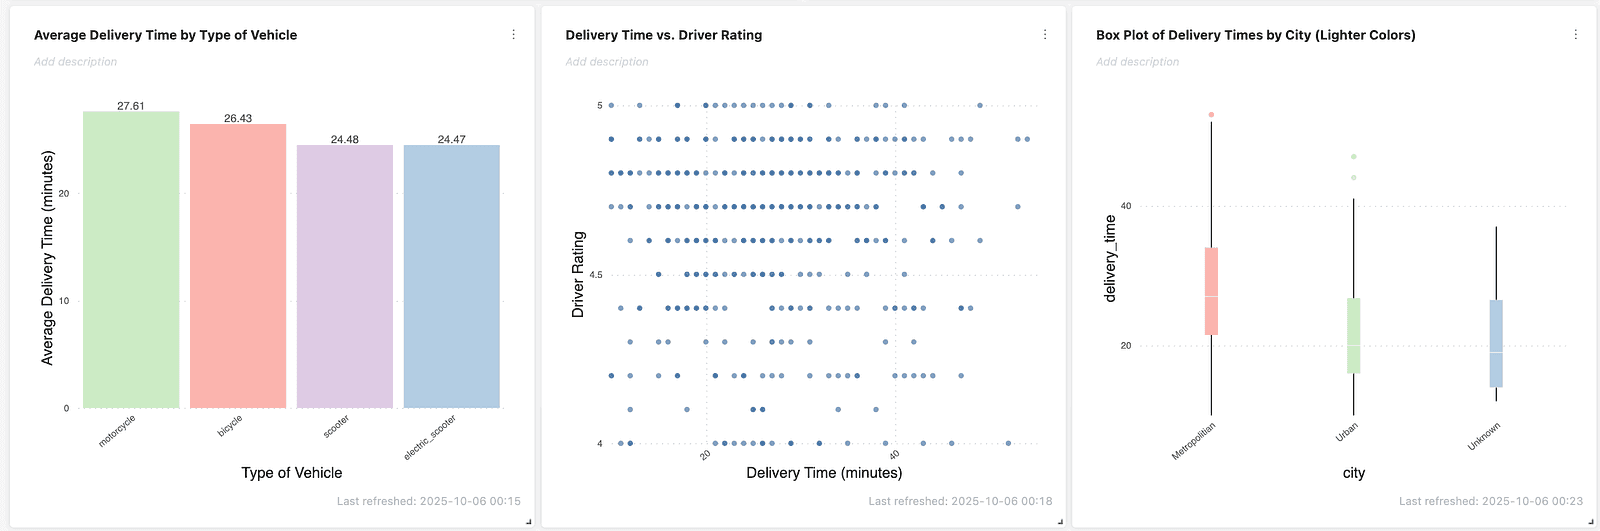
We also include a few charts to provide a clear, at-a-glance view of overall performance.
2. Where are the biggest delays in our process?
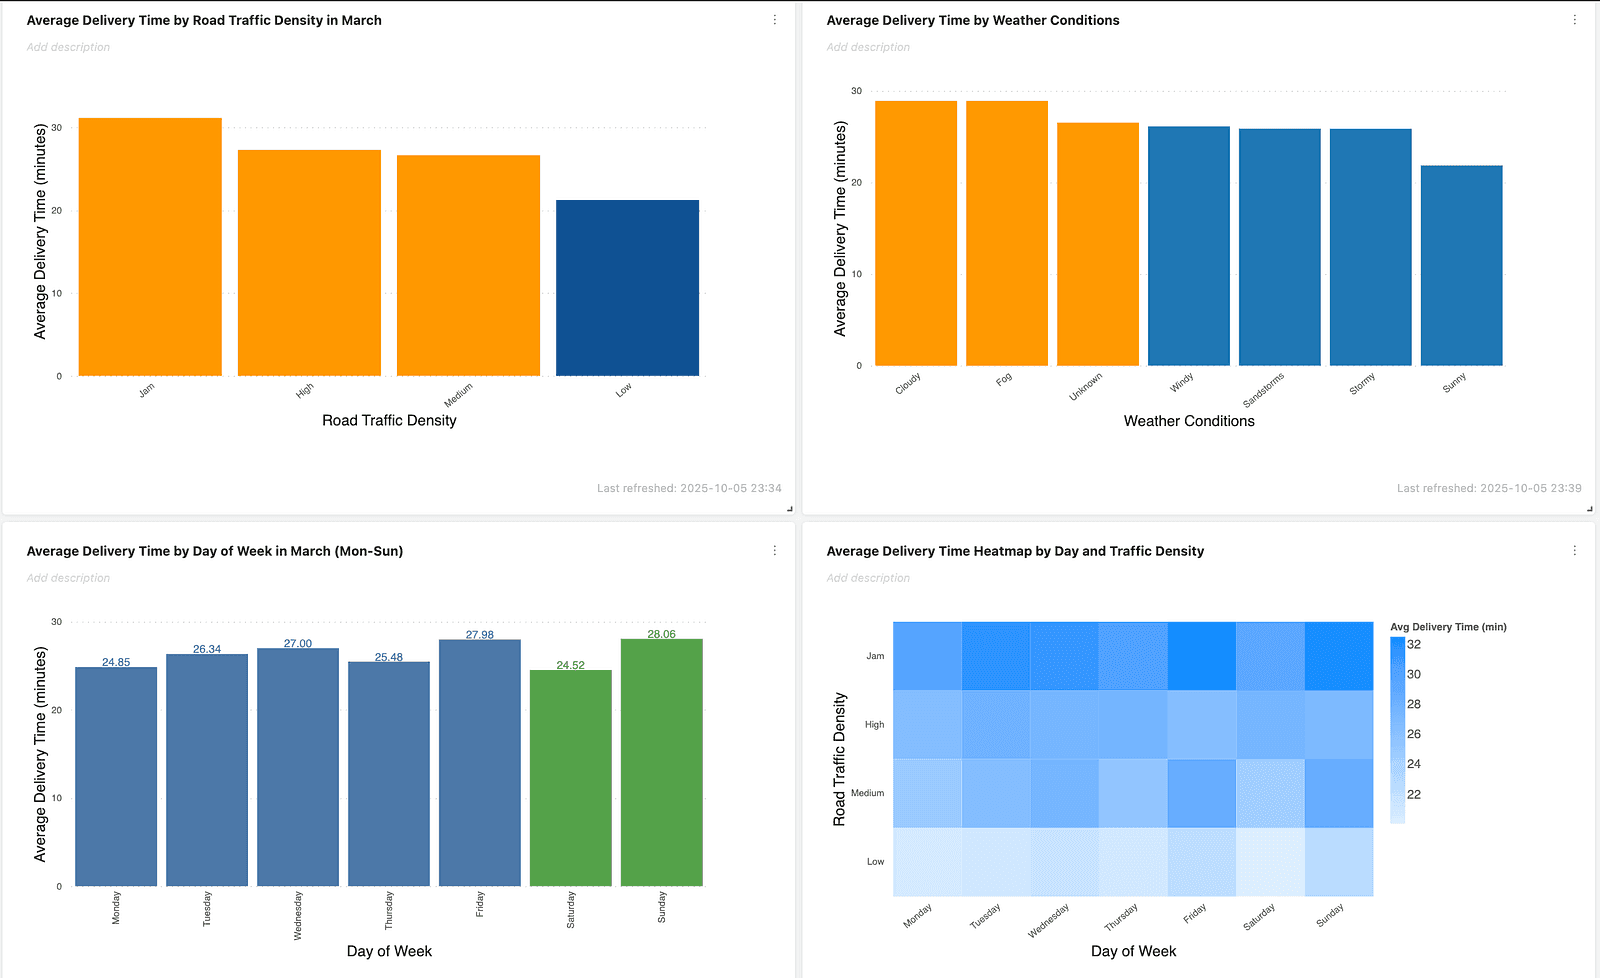
To dig deeper, we looked at average delivery time by traffic, weather, and day of the week. The data shows that deliveries take the longest when the traffic is jammed and the weather is cloudy. From the daily chart, Fridays and Sundays are the busiest, which aligns with the traffic heat map showing heavier congestion on those days.
The Breakthrough: Asking Your Data "Why?"
The limitation of a dashboard is that it's a monologue. It presents facts, but you can't interrogate them. To find real, actionable insights, you need a dialogue. This is where conversational AI tools like Wren AI are changing the game. Instead of just viewing the chart, your operations manager can now directly ask the critical follow-up questions that lead to breakthroughs. Let's revisit our dashboard, but this time, with Wren AI.
Scenario 1: The Traffic Jam Bottleneck
Your dashboard clearly shows that "Jam" traffic is a performance killer. An operations manager sees this and, instead of just sighing in frustration, they turn to Wren AI and ask:
"What is the average delivery time for motorcycles versus electric scooters in Metropolitan areas during Jam traffic?"
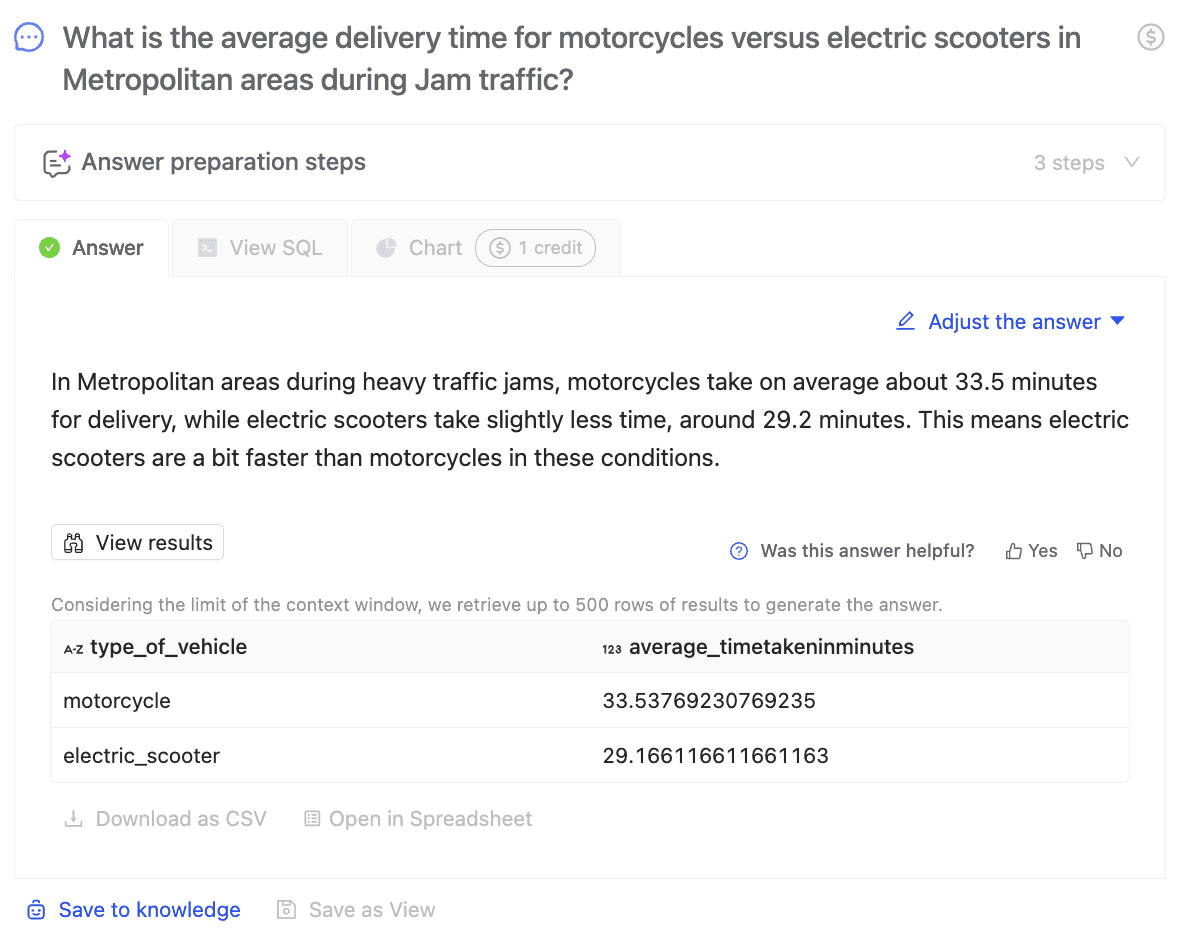
The Breakthrough: The problem isn't just the traffic; it's the vehicle type's effectiveness within that traffic. The resulting action is clear and immediate: start a pilot program to prioritize scooter dispatch in high-density areas during peak hours.
Scenario 2: Decoding Driver and Fleet Performance
Your dashboard has a section dedicated to driver and fleet metrics, helping you answer the question:
3. How is our driver and fleet performance?
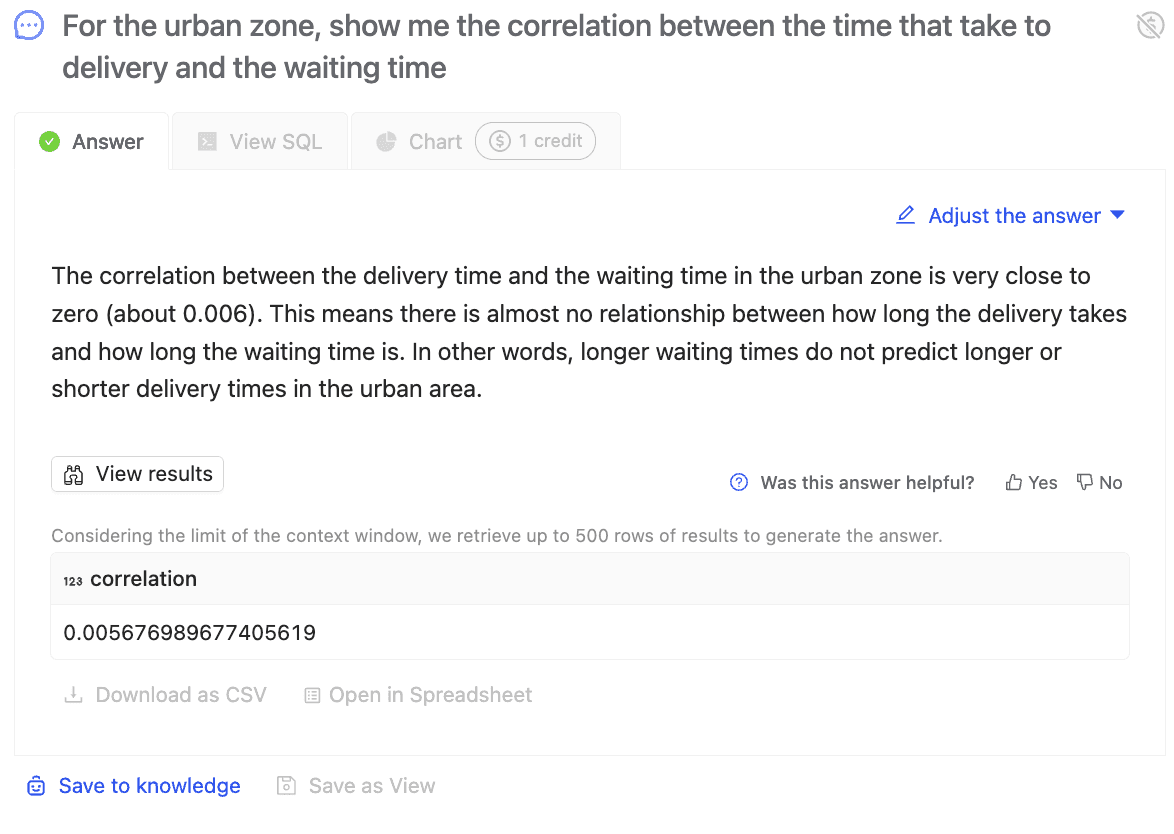
"For the urban zone, show me the correlation between the time that take to delivery and the waiting time."
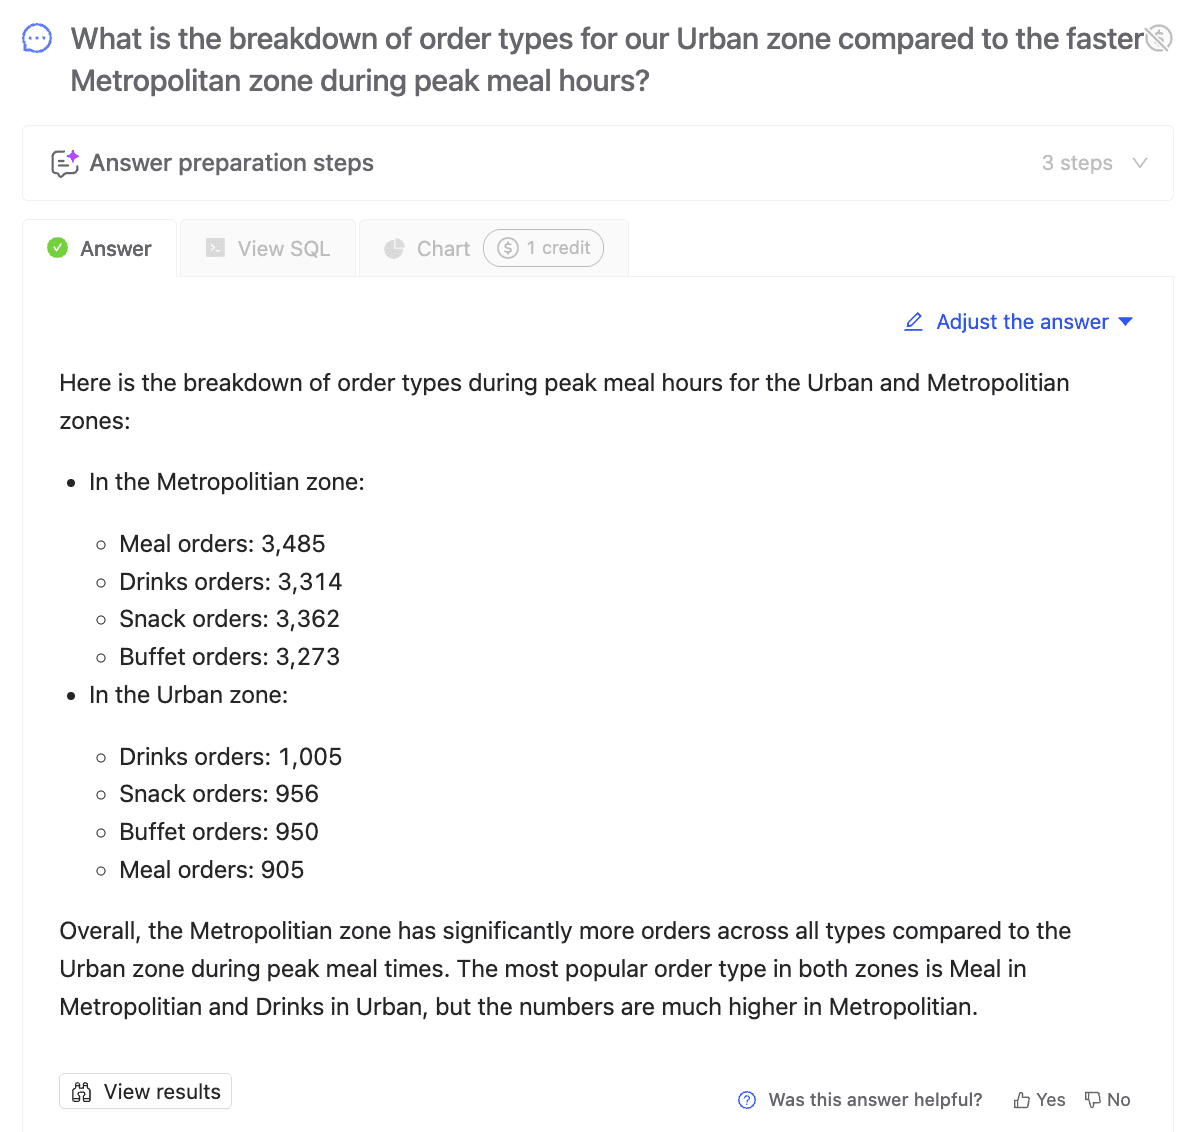
"What is the breakdown of order types for our Urban zone compared to the faster Metropolitan zone during peak meal hours?"
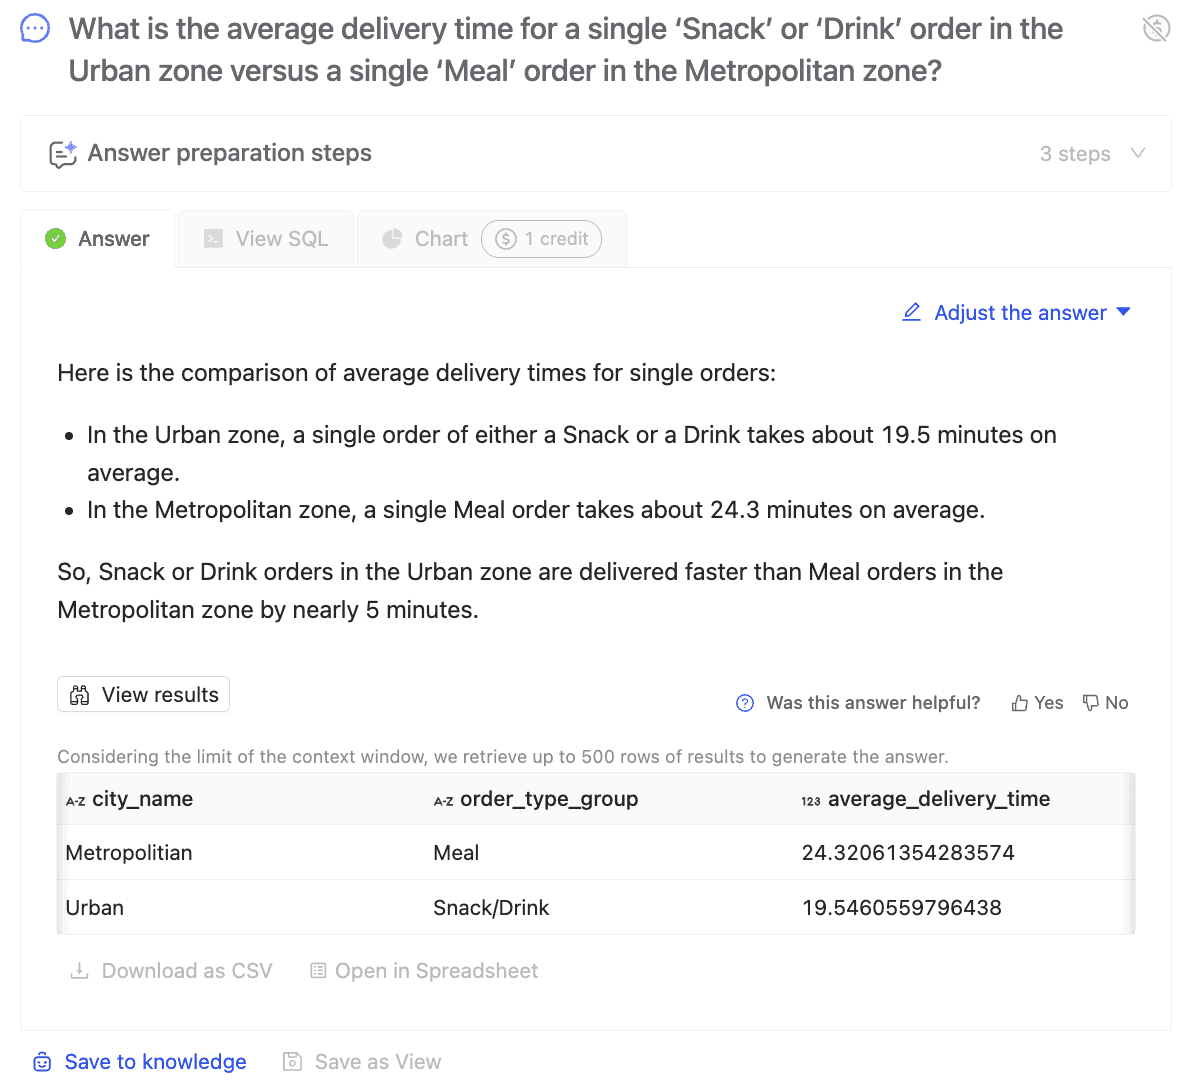
"What is the average delivery time for a single 'Snack' or 'Drink' order in the Urban zone versus a single 'Meal' order in the Metropolitan zone?"
"Compare the 'multiple deliveries' rate for 'Snack' and 'Drink' orders in the Urban zone against 'Meal' orders in the Metropolitan zone."
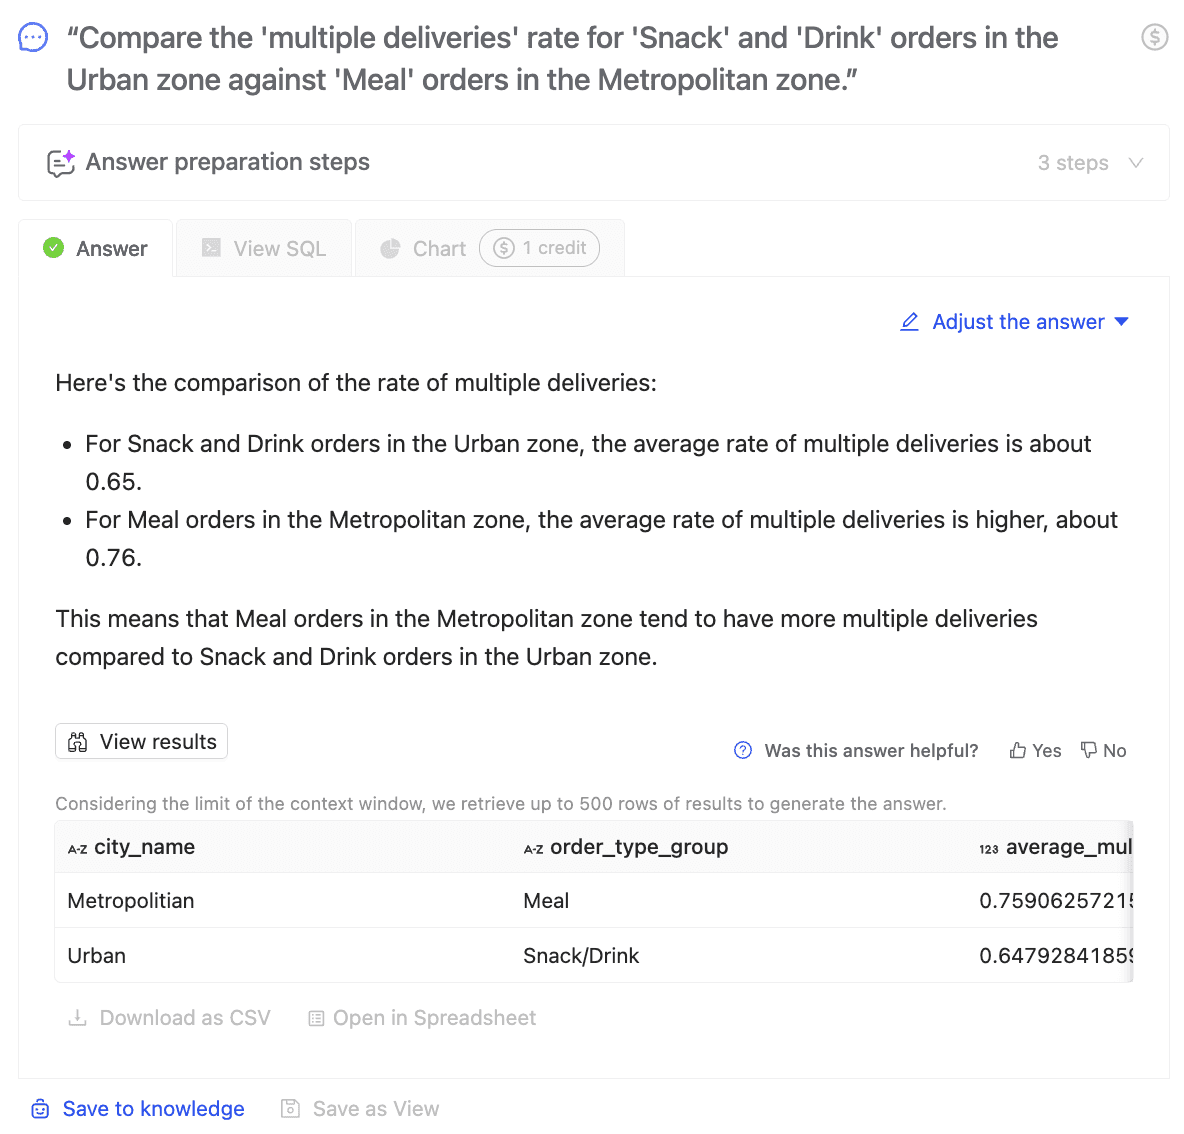
The Breakthrough: An 11-percentage-point gap in batching efficiency is a massive lever for profitability. It means that for every 100 delivery opportunities, the Metropolitan zone is successfully creating 11 more multi-order trips than the Urban zone.
The insight is that the Urban zone suffers from a persistent efficiency drag. Each successful "stacked" delivery dramatically lowers the cost-per-order and increases revenue per driver hour. The Metropolitan zone benefits from a powerful double effect: a higher batching rate on orders that already have a higher average value (Meal). The Urban zone has the opposite problem: a consistently lower batching rate on orders that are, by nature, low-value.
This seemingly small gap, compounded over thousands of orders a day, perfectly explained why the Urban zone was less profitable despite its faster individual delivery times.
This discovery gave the strategy team a clear, quantifiable goal: close the 11% efficiency gap. Instead of focusing on speed, they could now work on targeted solutions:
- Launching "add-on" promotions ("Add a cookie for $1") to increase the value and batching probability of small orders.
- Testing a more patient dispatching algorithm in the Urban zone that holds low-value orders for an extra 90 seconds to improve the chance of creating a stack.
From Being Informed to Being Empowered
Dashboards are essential for informing us about our performance. But information is not the same as insight.
Conversational AI tools like Wren AI empower your teams to move beyond the "what" and start asking "why." They turn every team member into their own data analyst, allowing them to investigate hunches, validate strategies, and find the hidden efficiencies that dashboards alone could never reveal.
In the food delivery industry, the company that can answer questions the fastest will win. The revolution isn't just about getting food to the door quicker; it's about getting insights to your team at the speed of thought.
Ready to transform how your organization accesses data? Request a demo or start your free trial at getwren.ai
See governed GenBI in action
Watch short demos of Wren AI turning business questions into governed SQL, charts, and reusable GenBI apps.
Watch product demosRelated posts
AI-Powered Business Intelligence: The Complete Guide to GenBI
Discover how Generative Business Intelligence (GenBI) powered by Wren AI is transforming data access with conversational AI, real-time insights, and intuitive decision-making tools for modern enterprises
Sep 17, 2025Beyond Dashboards How Conversational AI is Revolutionizing Structured Finance Analytics
How Wren AI transforms complex financial data into instant, actionable insights through natural language, no technical expertise required
Oct 17, 2025Conversational Analytics on Hotel Data-Turning 50K Reviews into Insights with Wren AI
No complex schemas. No SQL. Just your data - and instant answers.
The Wren Journal
Get the next deep dive in your inbox
Practical GenBI guides, product updates, and customer lessons from the Wren AI team. A couple of emails a month, no noise.

Keep reading
Insight, Product
AI-Powered Business Intelligence: The Complete Guide to GenBI
Discover how Generative Business Intelligence (GenBI) powered by Wren AI is transforming data access with conversational AI, real-time insights, and intuitive decision-making tools for modern enterprises
Insight, Trend
Beyond Dashboards How Conversational AI is Revolutionizing Structured Finance Analytics
How Wren AI transforms complex financial data into instant, actionable insights through natural language, no technical expertise required
Tutorial
Conversational Analytics on Hotel Data-Turning 50K Reviews into Insights with Wren AI
No complex schemas. No SQL. Just your data - and instant answers.